A percentage without the number of thumbnail appearances can send you towards the wrong fix. Your thumbnail might need work, or your video might simply be reaching people who have never watched you.
So I think the real question is not "what is a good CTR". It is whether to change your next thumbnail, improve the opening, or leave a growing video alone.
Quick answer
- Impressions are the number of times YouTube put your thumbnail in front of somebody. YouTube says half of channels and videos have an impressions click-through rate, or CTR, the share of those people who clicked, between 2% and 10%. That is not a target.
- YouTube CTR measures views following counted thumbnail appearances, not every view. Counted impressions require at least 50% visibility for over 1 second.
- YouTube's worked example falls from 9% to 3.5% CTR while impressions grow from 10,000 to 100,000. A falling rate can accompany growth.
- vidIQ publishes channel-size guidance, not an independently auditable CTR study. Do not use its ranges as pass marks.
Check your own video: paste the link in the free outlier checker. It shows the maths and takes a second.
- YouTube's 2 to 10% CTR Range Is Not an Average
- YouTube CTR Counts Only Eligible Thumbnail Impressions
- YouTube CTR Benchmarks by Channel Size Are Coaching Ranges
- High YouTube CTR on Low Impressions Does Not Prove Growth
- Traffic Sources Make Your YouTube CTR Comparisons Fairer
- A Good CTR Must Lead to a Satisfied Viewer
- Conclusion (What I Would Do)
- FAQ: YouTube CTR
YouTube's 2 to 10% CTR Range Is Not an Average
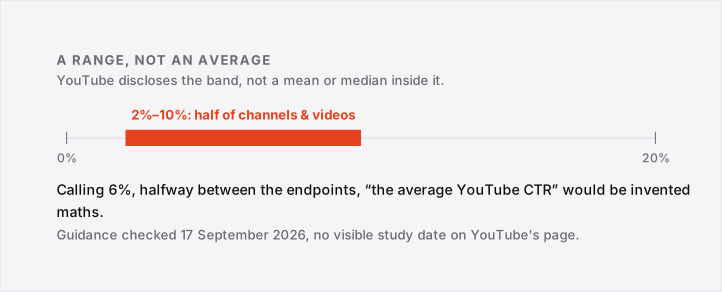
YouTube says half of channels and videos have an impressions CTR between 2% and 10%. That is a broad range, not a performance target or a platform average.
The page gives no mean, the ordinary average, or median, the middle result after sorting. So calling 6% the average YouTube CTR would be invented maths.
The page shows no study date, so I would treat the range as YouTube's guidance checked on 17 September 2026.
Three more official caveats come with it:
- New videos and channels under a week old, or videos under 100 views, show an even wider range.
- Videos with most impressions from Home naturally run a lower CTR than videos shown mainly on channel pages.
- YouTube says to compare CTR between your own videos over the long term, keeping the traffic source the same.
So the honest answer starts here: 2 to 10% contains half of YouTube, and where you sit inside it depends on things CTR alone does not show.
YouTube CTR Counts Only Eligible Thumbnail Impressions
Impressions CTR is the share of counted thumbnail appearances that lead to a view. The denominator, the number you divide by, is registered impressions. The numerator is views from those impressions, not total views.
According to YouTube's counting rules, at least 50% of the thumbnail must be visible for longer than 1 second. A passing glimpse is not automatically an impression.
Some Views Sit Outside the Calculation
YouTube excludes several places where people can still find and watch your video:
- External websites and apps, including embedded videos.
- Email and notifications.
- Cards and end screens inside the video player.
So a notification can bring a real viewer without adding a counted impression. Dividing all your views by impressions mixes different groups and will not reproduce Studio's CTR.
The Arithmetic Uses Views From Impressions
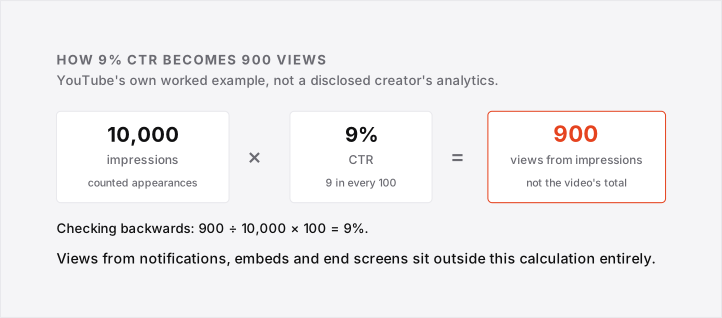
YouTube's worked example starts with 10,000 impressions and 9% CTR. These are teaching numbers from YouTube, not a creator's analytics.
Nine percent means nine in every hundred. So 10,000 × 0.09 = 900 views from impressions. Checking backwards: 900 ÷ 10,000 × 100 = 9%.
Those 900 views are not necessarily the video's total, since views from excluded sources sit outside this calculation.
For your own video, open Analytics and then the Reach tab. The impressions funnel there shows the steps from thumbnail appearances to views and watch time, the total time people spend watching. Use matching dates throughout.
YouTube CTR Benchmarks by Channel Size Are Coaching Ranges
vidIQ publishes the ranges below, but the cited page gives no sample size or measurement period, so you cannot check them independently.
These are coaching ranges, not a study. A published recommendation is real advice from a named source, but it is not proof that channels of that size achieve that result.
| Channel size by subscribers | vidIQ's typical CTR range | How to use the number |
|---|---|---|
| Under 1,000 | 8 to 20% | Check whether impressions mainly reach existing viewers |
| 1,000 to under 10,000 | 5 to 12% | Compare similar uploads, not subscriber totals alone |
| 10,000 to under 100,000 | 4 to 8% | Separate Search from Home and Suggested |
| 100,000 to under 1 million | 2 to 6% | Read the rate beside impression growth |
| 1 million or more | 1.5 to 4% | Do not mistake broad reach for failed packaging |
Source: vidIQ's CTR guide, by Lydia Sweatt and Darryl Rentz, updated 27 May 2026. The last column is BT's advice, not a second dataset. These are not YouTube's official targets.
A subscriber count does not tell you who saw this upload. A small channel can reach strangers, and a large one can post a specialist video that mostly reaches regulars.
YouTube's explanation concerns fewer impressions and a more loyal audience. It does not say being small automatically raises CTR.
I personally would use the table to question a comparison, not grade a channel. An 8% minimum for every beginner would turn uncertain vendor guidance into a rule.
BT has no representative private-analytics dataset for CTR by channel size, and public views cannot fill that gap. For weekly breakdowns, join the newsletter.
High YouTube CTR on Low Impressions Does Not Prove Growth
A high CTR on low impressions shows that the people who saw your thumbnail often watched. It does not show that a wider audience would respond the same way.
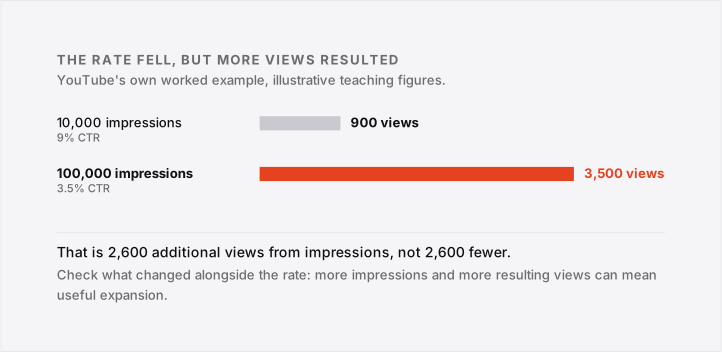
YouTube's example starts at 10,000 impressions and 9% CTR, then reaches 100,000 impressions at 3.5% after a week. YouTube describes the broader reach as success.
A Lower Percentage Can Produce More Views
The early figures imply 900 views from impressions. The later calculation is 100,000 × 0.035 = 3,500 views from impressions.
So the rate fell, but the views rose by 2,600, not fell by 2,600. These sums extend YouTube's illustrative example; they are not measured BT results.
But not every CTR decline is healthy. Check what changed alongside it:
- More impressions and more views from them: the lower rate may accompany useful expansion.
- Few impressions and high CTR: the video may appeal to a narrow audience without wider demand.
- Falling CTR at comparable reach and sources: investigate the topic, title and thumbnail.
More Observations Do Not Fix an Unrepresentative Audience
A large sample of loyal viewers cannot tell you how strangers will react. And a small early sample can swing on a few viewing decisions.
YouTube advises waiting for a substantial number of impressions before judging CTR, without a universal minimum. Anyone promising a fixed count proves your thumbnail works is adding their own rule.
I think the better first question is whether the audience expanded, before calling a lower percentage a thumbnail failure.
Traffic Sources Make Your YouTube CTR Comparisons Fairer
A traffic source is where someone finds your video. Search, Home and Suggested reach people in different situations, so comparing their CTRs as though they were interchangeable can mislead you.
YouTube's guidance says Search often brings fewer impressions but higher CTR, because someone asked for the topic. On Home, your video competes for attention without that request.
Compare the Same Source and Video Age
YouTube's thumbnail and title tips suggest checking Home and Suggested CTR in the first 24 hours on videos with above-average impressions. For subscribers, look at the Subscriptions feed over that same window.
That is an evaluation window, not a deadline. Keep these details beside the percentage:
- Traffic source: compare Search with Search, not Search with Home.
- Time since publication: compare an early window with the same early window.
- Impression count: note whether one video reached a much wider audience.
- Topic and format: use uploads aimed at a similar need.
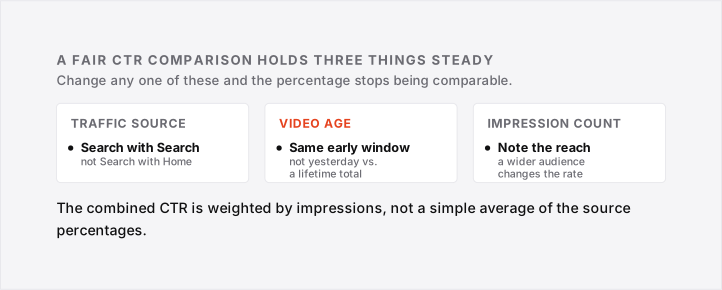
The combined CTR is weighted by impressions, not a simple average of the source percentages.
So it can fall because more impressions came from a lower-CTR source, even when each source held steady. Check the breakdown before blaming the design.
Also, judge a video against your baseline, the normal result of comparable uploads.
An outlier score is a video's views divided by that normal. Our outlier score guide explains it, and the free outlier checker scores one video. It does not show private CTR.
A Good CTR Must Lead to a Satisfied Viewer
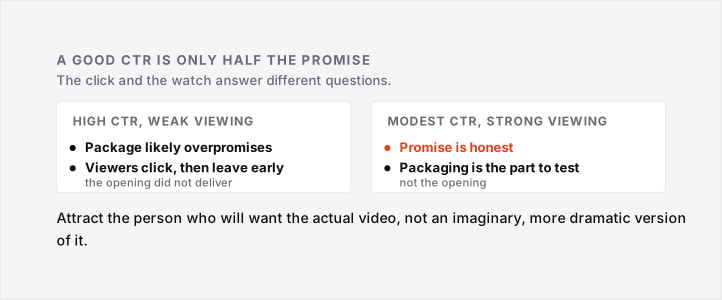
A good CTR earns attention without promising something the video fails to deliver. Packaging is the title and thumbnail together. Your viewer judges that promise before clicking, then again once playback starts.
YouTube's discovery guidance lists signals like average view duration and average percentage viewed, meaning how much of the video people watch. A click is not the whole outcome.
Read the Click and the Opening Together
If people click but leave early, check whether the opening delivers what the title and thumbnail promised. Audience retention, the share still watching at each point, helps locate the drop.
A weak opening is one possibility, not a diagnosis from CTR alone. The topic or pace may simply not suit them.
YouTube's testing guidance prioritises watch time over CTR. The thumbnail that wins more clicks does not automatically win more watching.
I think that is the useful design constraint: attract the person who will want the actual video, not a more dramatic imaginary one.
If packaging is the suspect, the free thumbnail tester previews it in YouTube's layouts, and our thumbnail change research covers swapping one. For low views generally, see why a video is not getting views.
Conclusion (What I Would Do)
A useful CTR review ends with a decision about your video, not a grade from a benchmark table. I would pick one recent upload and compare it with similar videos on my own channel.
My checklist would be:
- Record the date window, impression count and CTR together.
- Separate the major traffic sources before interpreting the combined rate.
- Check views from impressions and time watched alongside the percentage.
- Inspect the opening if viewers click but do not stay.
- Test packaging only when the evidence points to a weak or misleading promise.
If impressions and resulting views are growing, I would not replace a thumbnail just because CTR fell. And if the sample is tiny, I would keep publishing rather than redesign around every movement.
For ideas, use our free outlier workflow. Study the topic and promise, but do not infer their CTR from public success.
The next step: save a source-matched comparison for your latest upload, and write down what would justify a change before making one.
FAQ: YouTube CTR
These questions cover measurements and comparison traps that look similar inside Studio.
What is a good CTR for YouTube Shorts?
YouTube's Shorts guidance gives no universal CTR target. For Shorts-feed performance, look at Shorts analytics, including “How many chose to view”, the percentage who viewed rather than swiped away. That is not thumbnail CTR.
Does a 10% CTR guarantee YouTube will recommend my video?
No. YouTube explains that strong CTR and viewing duration do not guarantee impression growth. A narrow topic may have limited demand, or competing videos may suit the audience better. Ten percent is not a published threshold.
Can I see another channel's CTR with an outlier tool?
Not from public view counts alone. CTR needs registered impressions and the views from them, which public video pages do not show. A creator can share private analytics, but an outlier ranking is not a substitute.
Should I average the CTR percentages of my uploads?
Not to reproduce an overall rate. Add the views from counted impressions, divide by total counted impressions, then multiply by 100. A plain average gives a tiny upload the same weight as one with far more impressions.