You keep hearing creators quote an "outlier score", a number like 3x or 4x, but nobody says what it measures.
So I ran the maths on real channels anyone can check, and matched it against our own thresholds.
By the end, you can work out your own score for free and know when the number is worth believing.
Quick answer
- A YouTube outlier score is one division: views divided by the baseline, meaning that channel's normal recent views.
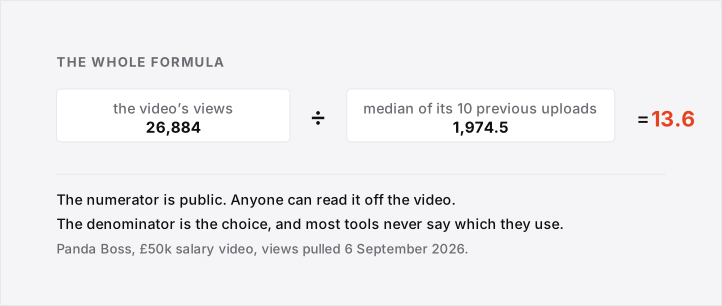
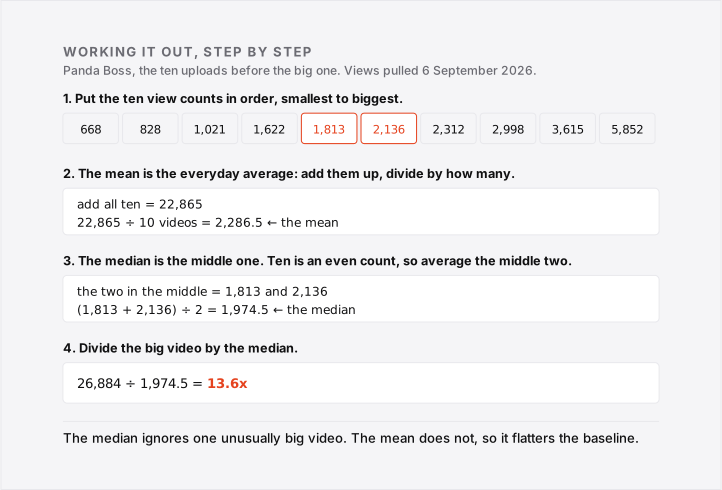
- Panda Boss's £50k-salary video got 26,884 views against a 1,974.5 median baseline, the median being the middle value once sorted: 13.6x.
- We flag a video as an outlier once it beats the channel's median by more than 5x.
- A second video on the same channel must clear 10x too, before we call the channel repeatable rather than a one-off.
- In one of our own YouTube outlier breakdowns, a channel with a 228-view median across five uploads still scored 508.6x on its one big video.
- What A YouTube Outlier Score Means
- How To Calculate A YouTube Outlier Score On A Real Channel
- What Counts As A Good YouTube Outlier Score
- Why A Small Channel's Outlier Score Lies
- Why A Channel's Outlier Score Changes With Too Few Videos
- Outlier Score Versus Views Per Hour
- Conclusion (What I Would Do)
- FAQ: YouTube Outlier Scores
What A YouTube Outlier Score Means
A YouTube outlier score is the same comparison every time: a video's views set against that channel's own recent average, the number creators call the baseline.
So a high score means the video beat its own normal, not YouTube as a whole.
A smaller channel's video can outrank a bigger channel's video, because the score measures a video only against its own channel.
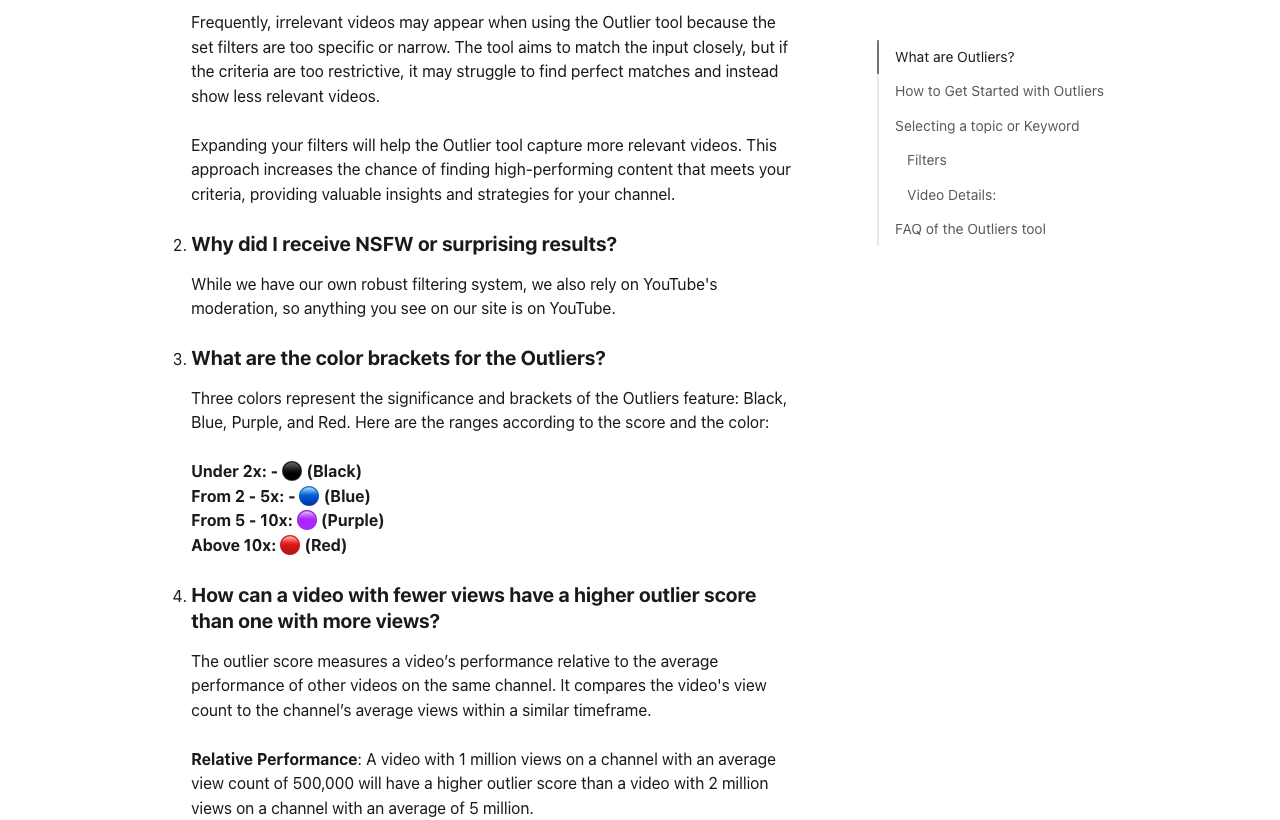
vidIQ's own example proves it: 1 million views beats a 500,000 average, while 2 million views on a 5-million-average channel does not.
Most Tools Never Publish Their Denominator
OverseerOS' outlier page is the only ranking page with a written formula: views divided by channel average, over the last 20 to 50 videos.
- Most tools never say whether they use the mean, the everyday average, or the median, the middle number once sorted, and one big video moves a mean far more than it moves a median.
- ViewStats doesn't disclose its window; Tukey.ai publishes 20 to 30, OverseerOS publishes 20 to 50: two of the few that do.
- Pick one window and reuse it, so your own scores stay comparable.
How To Calculate A YouTube Outlier Score On A Real Channel
A real channel's score is one division; the average you pick changes the answer, as of 6 September 2026.
Panda Boss, 26,884 Views Against A 1,974.5 Baseline
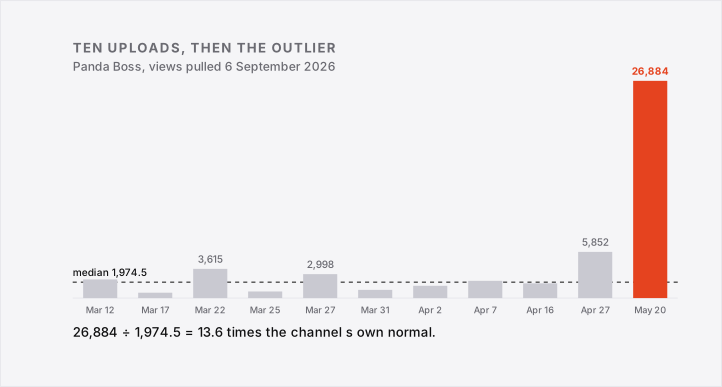
Panda Boss's video on a £50k UK salary pulled 26,884 views.
The ten uploads before it add up to 22,865, which is a mean of 2,286.5. The median, the middle value, is 1,974.5, and dividing 26,884 by those two numbers gives 11.8x and 13.6x.
The highest of the ten, 5,852, sits close to the rest: Panda Boss's history reads as a clean baseline.
| Channel | Outlier video | Mean baseline | Median baseline | vs mean | vs median |
|---|---|---|---|---|---|
| Panda Boss | 26,884 | 2,286.5 | 1,974.5 | 11.8x | 13.6x |
| Insights4UToday | 71,091 | 10,009 | 3,613.5 | 7.1x | 19.7x |
Why The Median Beats The Average
Insights4UToday's outlier video shows why the choice matters.
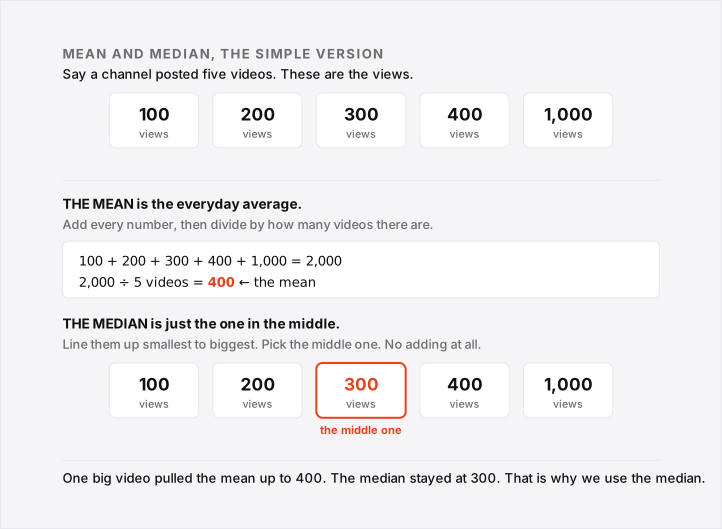
That video reads 7.1x against a 10,009 mean, but 19.7x against a 3,613.5 median, because two strong videos inside it pull the mean up.
Here's the idea, in simple made-up numbers, before the real ones.
- Pull the ten uploads before your newest video, oldest to newest, noting each view count.
- Find the median: sort the ten values, average the middle two (ten splits evenly).
- Divide your newest video's views by that median.
- Reuse the same window every time for comparable scores.
Our outlier score checker runs this maths.

What Counts As A Good YouTube Outlier Score
What counts as a good YouTube outlier score depends on which tool you ask, since none of them agree or say how they got their number.
Our Own Bar: Outlier Flag At 5x, Trust At 10x
| Source | Outlier flag | Trust it |
|---|---|---|
| vidIQ | 2x-5x | not stated |
| OutlierKit | 3x+ | not stated |
| Paddy Galloway | 3x-4x minimum | not stated |
| Breakdown Theory | 5x | 10x, and a second video has to clear it too |
vidIQ never names a trustworthy number, just a red 10x-plus tier and a 50+ filter it calls exceptional.
We flag a video at 5x; every count below was pulled on 6 September 2026. The 10x trust bar needs a second video to clear it, and none has yet.
Moronomy: 409,280 views, then 861. Nine videos total, a 532.5-view median across the six before it. Next upload: 861 (1.62x). One after: 3,546 (6.66x). Neither reached 10x. Watch the outlier video
TomYoungsPodcast: 428,044 views, then 38,502 against a 1,636 median. The four uploads since: 6,451, 38,502, 4,844, 11,755, best is 9.0% of the outlier. Watch the outlier video
A huge multiplier proves the video worked, not that the channel repeats it: one giant number is a story, not a method.
We also run one statistical check against the channel's own spread, so a freak-low baseline cannot fake a score alone.
"A video that gets 3 or 4 times more than the average at minimum on a channel." Paddy Galloway, Creator Science podcast
Neither vidIQ nor OutlierKit say whether their number means the mean or the median.
Why A Small Channel's Outlier Score Lies
A small channel's outlier score lies when its baseline is too thin, and our own numbers prove it against ourselves.
Our Own 508x, Two Verdicts
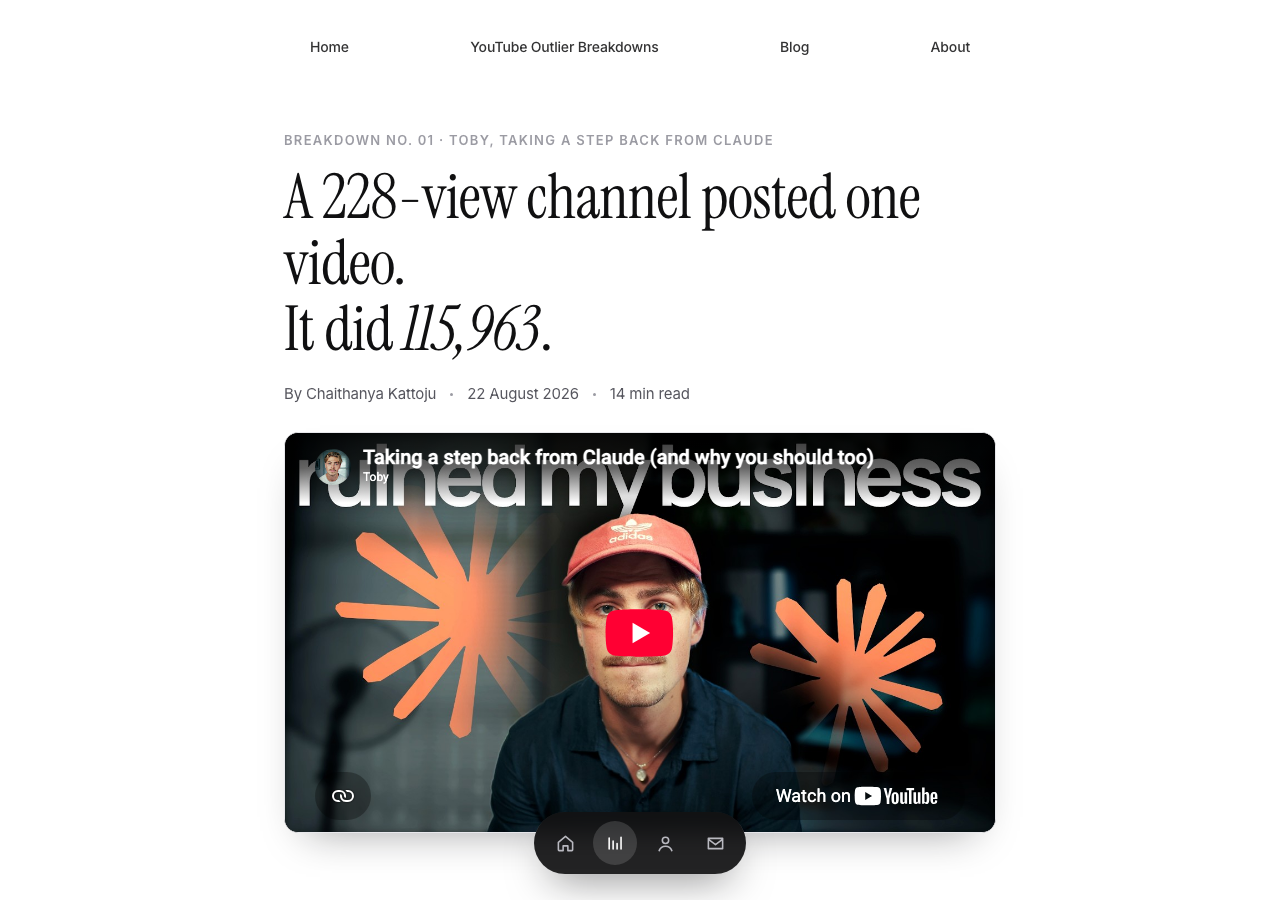
Toby, a 1,610-subscriber channel, hit 115,963 views on one video against a 228-view median across five uploads, all measured 21 August 2026.
That is 508.6x, confirmed by two internal tools: the headline number in our own YouTube outlier breakdown on Toby.
We ran two checks on Toby's channel and got different answers.
The first check looks at the channel's whole history. Only one video beat our bar, so it calls Toby a one-off.
The second check compares the big video to videos posted around the same time. An earlier, smaller video also beat the bar, so this check calls Toby a repeat.
The second check is the weaker one: it wants same-age videos to compare against, this channel had none, so it fell back to comparing against the whole channel.
Toby had no owned audience either: 243 Instagram followers, nothing else. I think the multiplier is real; the confidence is not.
Why A Channel's Outlier Score Changes With Too Few Videos
An Active Channel, A Thin Baseline
New Life by Noah has 76 uploads, but only six are long-form. That leaves almost nothing to compare one against.
Its best video got 152,907 views, pulled live 6 September 2026.
Against the one video before it, 73,873 views, that's 2.1x: 152,907 divided by 73,873.
Against the average of the two before it, 73,873 and 22,154, which average 48,014, that's 3.2x: 152,907 divided by 48,014.
Against the average of all three before it, 73,873, 22,154 and 68,889, which average 54,972, that's 2.8x: 152,907 divided by 54,972.
These are mean-based, not median: three videos is too few for a real median. The baseline shifts with how many you include, so the same video scores differently.
- Too few uploads means no stable number to divide by.
- One lucky earlier video can swing a small average either way.
- A tool can refuse: vidIQ's own AI Coach told an under-200-subscriber channel it lacked data to rank outliers.

Subscribe for more like this: a new YouTube outlier breakdown lands in your inbox the same day it goes live.
Outlier Score Versus Views Per Hour
Outlier score and views per hour, which means how fast a video earns views after publishing, both try to answer whether a video is unusually good, but only one of them is baseline-relative.
Velocity Fires First, And The Window Is Short
| Outlier score | Views per hour | |
|---|---|---|
| What it measures | Total views vs channel baseline | Speed of views right after publish |
| When it is useful | Once early views settle, past the 7-hour half-life below | That same early window, inside the 10-day study below |
| Known failure mode | Lies on a thin baseline | A raw threshold is a bad signal |
An arxiv study of over 50,000 news videos found the average 24-hour view half-life, when a video already has half its first day's views, lands around 7 hours.
Metricool's 2026 study of 799,718 videos found 83% of a video's lifetime interactions land inside its first 10 days.
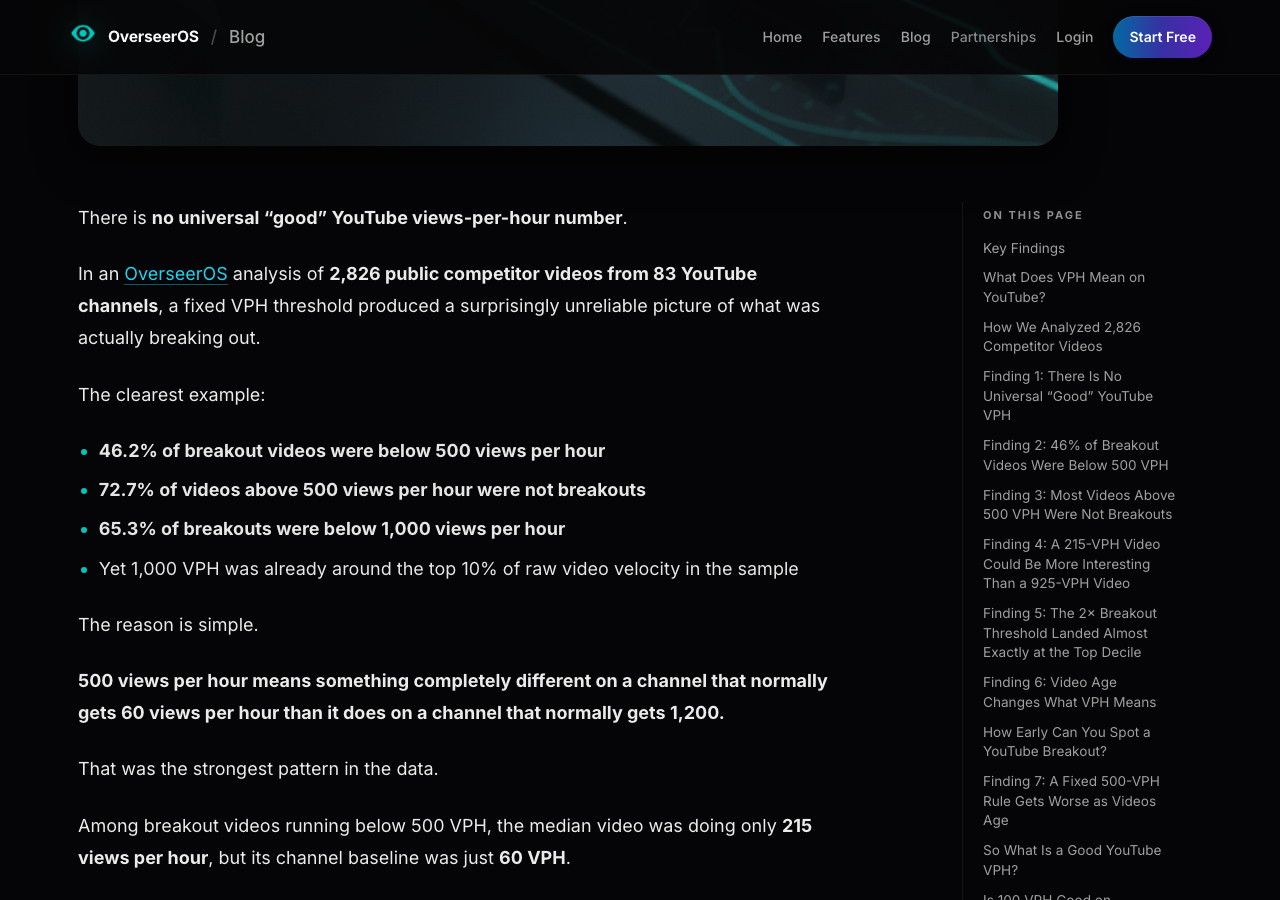
OverseerOS' VPH study of 2,826 videos across 83 channels found 46.2% of what it calls breakouts sat below 500 views per hour, and 72.7% of videos above 500 were not breakouts.
OverseerOS defines a breakout as a video at 2x its channel's baseline velocity, not an official YouTube category.
That baseline-relative definition is why a raw 500-views-per-hour cutoff misses so many of them.
Breakouts under 500 views per hour had a median raw velocity of 215, but ran 2.87x baseline. Non-breakouts above 500 had a median velocity of 925, but only 0.88x baseline.
Our own outlier code does not compute views per hour. The VPH numbers we cite come from vidIQ's reading, not ours, and every study in this section is external.
Conclusion (What I Would Do)
I would only trust a score once ten uploads sit in the baseline. Below that, treat the number as a headline, not a verdict.
The trap is a big multiplier on a thin channel. The Toby YouTube outlier breakdown above read 508.6x on a five-upload, 228-view median, and two of our own tools disagreed on it.
A huge number early on proves less than it looks like.
Now work out your own score. If ten uploads back it, trust what you get. If they don't, hold off and watch two more videos before you decide it means anything.
FAQ: YouTube Outlier Scores
How many videos do you need before an outlier score means anything?
Ten is where I want it before I trust it, though we will run one as thin as four.
New Life by Noah has 76 uploads, only six long-form, so the baseline swings hard. Treat anything under ten as a story, not a method.
Why do two tools give the same video a different outlier score?
They divide by different things: one might use the mean, another the median. Insights4UToday's video read 7.1x against the mean, 19.7x against the median.
What do the colours on a vidIQ outlier score mean?
vidIQ codes them black under 2x, blue from 2x to 5x, purple from 5x to 10x, red above 10x.
"I still don't understand what those numbers means (colored background with numbers)." One viewer
Do you need a paid tool to work out an outlier score?
No. It is one division: pull ten uploads' views, find the median, divide your newest video's views by it. A paid tool just saves the manual pull.
Does a high outlier score guarantee the video will keep doing well?
No.
"Love the vidiq tools sometimes high scores do good sometimes the middle do good." One commenter
A score shows what already happened, not what happens next.
Why does an outlier filter sometimes return an unrelated video?
Because the filter ranks by ratio, not topic. One creator asked why filtering for outliers surfaced only one totally off-topic video instead of anything in their niche.
A high ratio does not guarantee a relevant match, so check the topic yourself before trusting the filter's pick.