A typical video on Patrick O’Driscoll’s channel gets about 164 views, going by the middle value of everything else he has posted.
Then “The Psychology of Premium Ecommerce Brands” got 237,931 views when I checked it on 3 October 2026. That is roughly 1,446 times his usual.
A result that far outside a channel’s normal range is called an outlier. The bigger question for me is why only one kind of video ever takes off on this channel, while most of the rest stay in the hundreds.
So let’s look at the packaging, the opening and the rest of the edit, and see if there are things other creators can replicate for better views.
Quick answer
- The video got 237,931 views on a channel that usually gets about 164, roughly 1,446 times more.
- Search was ruled out: even the biggest related search term can explain at most 3.1% of the views.
- The subject is the strongest pattern: three multi-brand studies woke up late here, while the September ads and tactics videos stayed in the hundreds.
- A thumbnail swap about two days in lines up with the bend in the curve, but that is timing, not proof.
- The opening starts on the Peak Design backpack from the thumbnail, with exact prices on screen. My verdict is mostly strategy.
We are not associated with Patrick O’Driscoll, his channel or his agency, and we are not promoting them. This is an outlier we found, and it looked interesting enough to break down.
- Who Runs This Channel and What Does a Normal Upload Get?
- How Far Did This One Outrun Everything Around It?
- Where Could the Views Have Come From? (Search, News and Followers)
- Is It the Subject? (Brand Studies Versus Ads and AI Tutorials)
- Did the Thumbnail Swap Matter? (Famous Products, No Face)
- Did the Opening Do the Work? (Prices on Screen, No Name)
- Which Difference Do the Numbers Point To?
- How Would You Run This Test on Your Own Channel?
- What We Cannot See Without His Studio Data
Who Runs This Channel and What Does a Normal Upload Get?
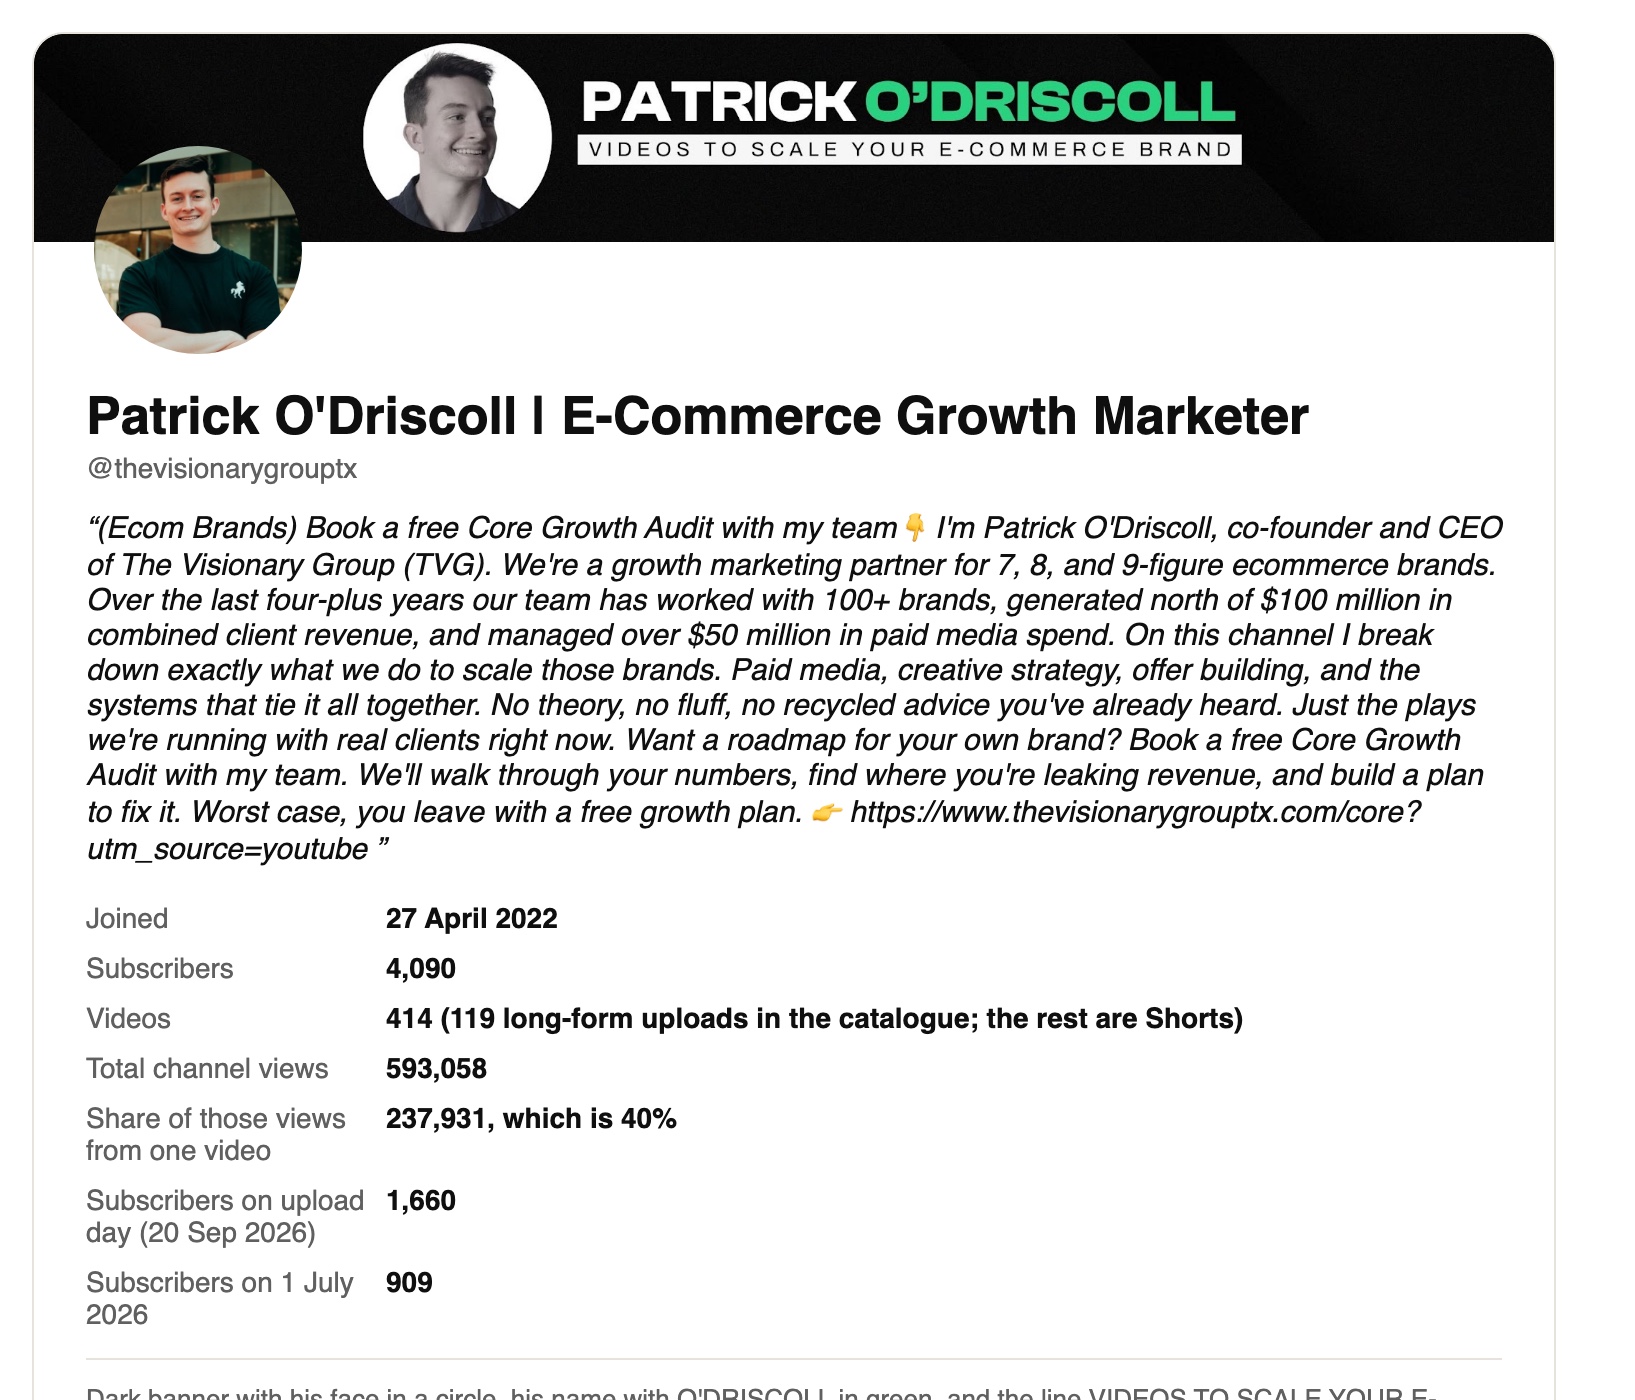

Patrick has a small audience, and a normal upload gets a few hundred views at best. I think the channel works mainly as a lead source for his agency, not a media business.
He is co-founder and CEO of The Visionary Group, or TVG, a growth agency in Dallas for ecommerce brands doing seven to nine figures a year. The About panel opens by selling a free Core Growth Audit.
The channel joined YouTube on 27 April 2022. I think the About panel explains the content: the channel exists to bring in agency leads, so views were never the only goal.
Here is what a normal upload looks like:
- 119 long videos in the catalogue, out of 414 total (the rest are Shorts, which are very short vertical videos)
- A median of 160 views for the 117 uploads before this one, ranging from 24 to 26,770
- A median of 164.5 views across all 118 other uploads
- 909 subscribers on 1 July 2026, 1,660 on upload day, 4,090 on 3 October
The median means half the videos got more than that number and half got less.
His other audiences are small too. I found his LinkedIn at about 10K followers, Instagram at 8,328, and a free Skool community with 540 members.
I could not find a Facebook page or a Discord server for him.
The topics also drifted over time:
- 2024: fitness coaching funnels and Klaviyo emails (Klaviyo is an email marketing tool)
- 2025 and early 2026: Meta ads and growth tactics
- From May 2026: mostly audits and studies of named consumer brands, still mixed with tactics videos
My verdict is that this is a small channel with a small audience, so a few hundred views is the right baseline to hold everything else against.
How Far Did This One Outrun Everything Around It?

It got 237,931 views against a usual 164.5, roughly 1,446 times more. That one video holds 40% of all 593,058 views the channel has ever had.
The video is 16 minutes 41 seconds long and had 3,019 likes and 49 comments. It was 12.8 days old when I measured it.
Here are the uploads around it, with views on 3 October:
- 31 July: “The Secret Behind Weirdly Addictive Brands”, 26,770 views
- 12 August: “How Bloom, Poppi, Grüns and IM8 Built Their Brands”, 24,543 views
- 1 September: “The Most Valuable Ecommerce CRO Training You’ll Ever Watch”, 467 views
- 7 September: “Claude Officially Just Changed Ecommerce Forever! (Tutorial)”, 656 views
- 15 September: “The Best Facebook Ad Creative Strategy For Ecommerce”, 639 views
- 30 September: a remake, “1,000 Hours Of Studying The Best Ecommerce Brands In 27 Minutes”, 9,499 views
CRO means conversion rate optimisation, which is getting more of your website visitors to buy.
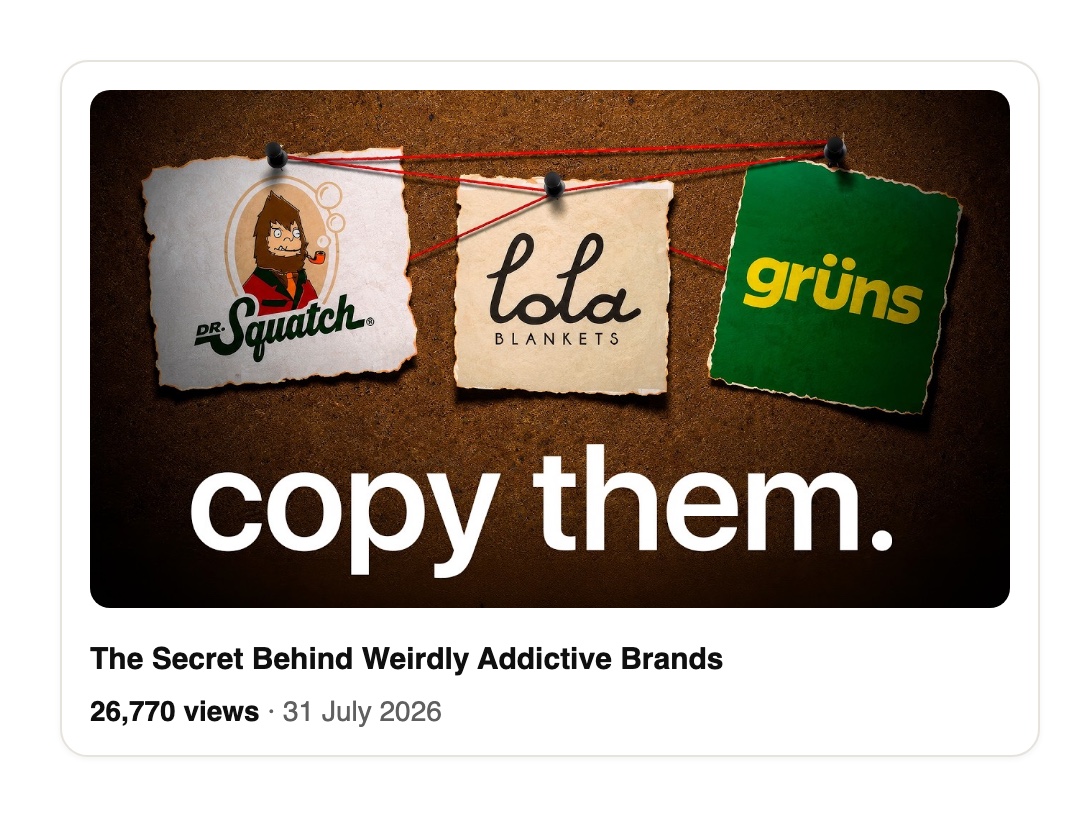
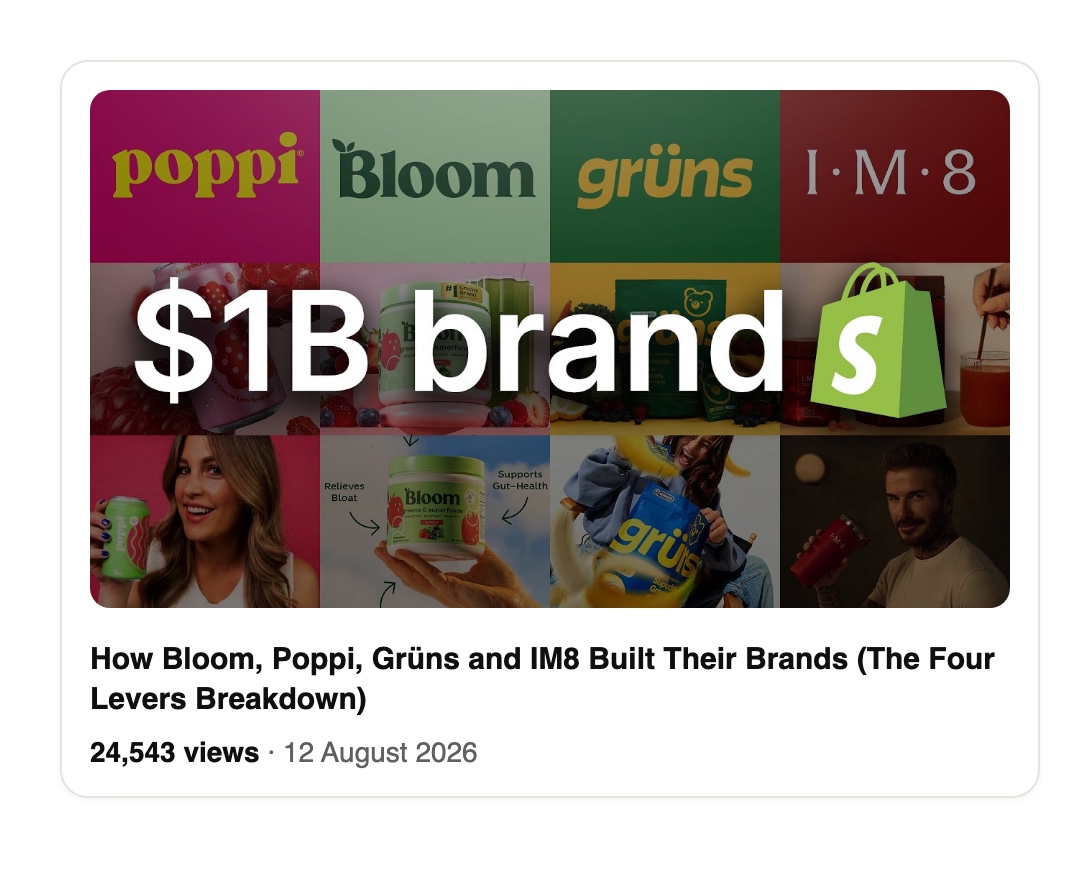
The daily numbers show how sudden the jump was. vidIQ, a YouTube analytics tool, records the views a video adds each day:
- 21 and 22 September: 458 and 527 views
- 23 September: 1,123 views
- 24 September: 5,166 views
- 29 September: 45,115 views, the biggest day
- 2 October: 22,047 views
The fastest hour was on 30 September, at 1,530 views an hour.
vidIQ’s own total on 3 October was 227,112, lower than the 237,931 from the catalogue. That is just two pulls at different times, not a contradiction.
My verdict is that this is a real and very large outlier, and I do not think it is a one-video accident, because two earlier uploads on this channel also broke out.
Where Could the Views Have Come From? (Search, News and Followers)
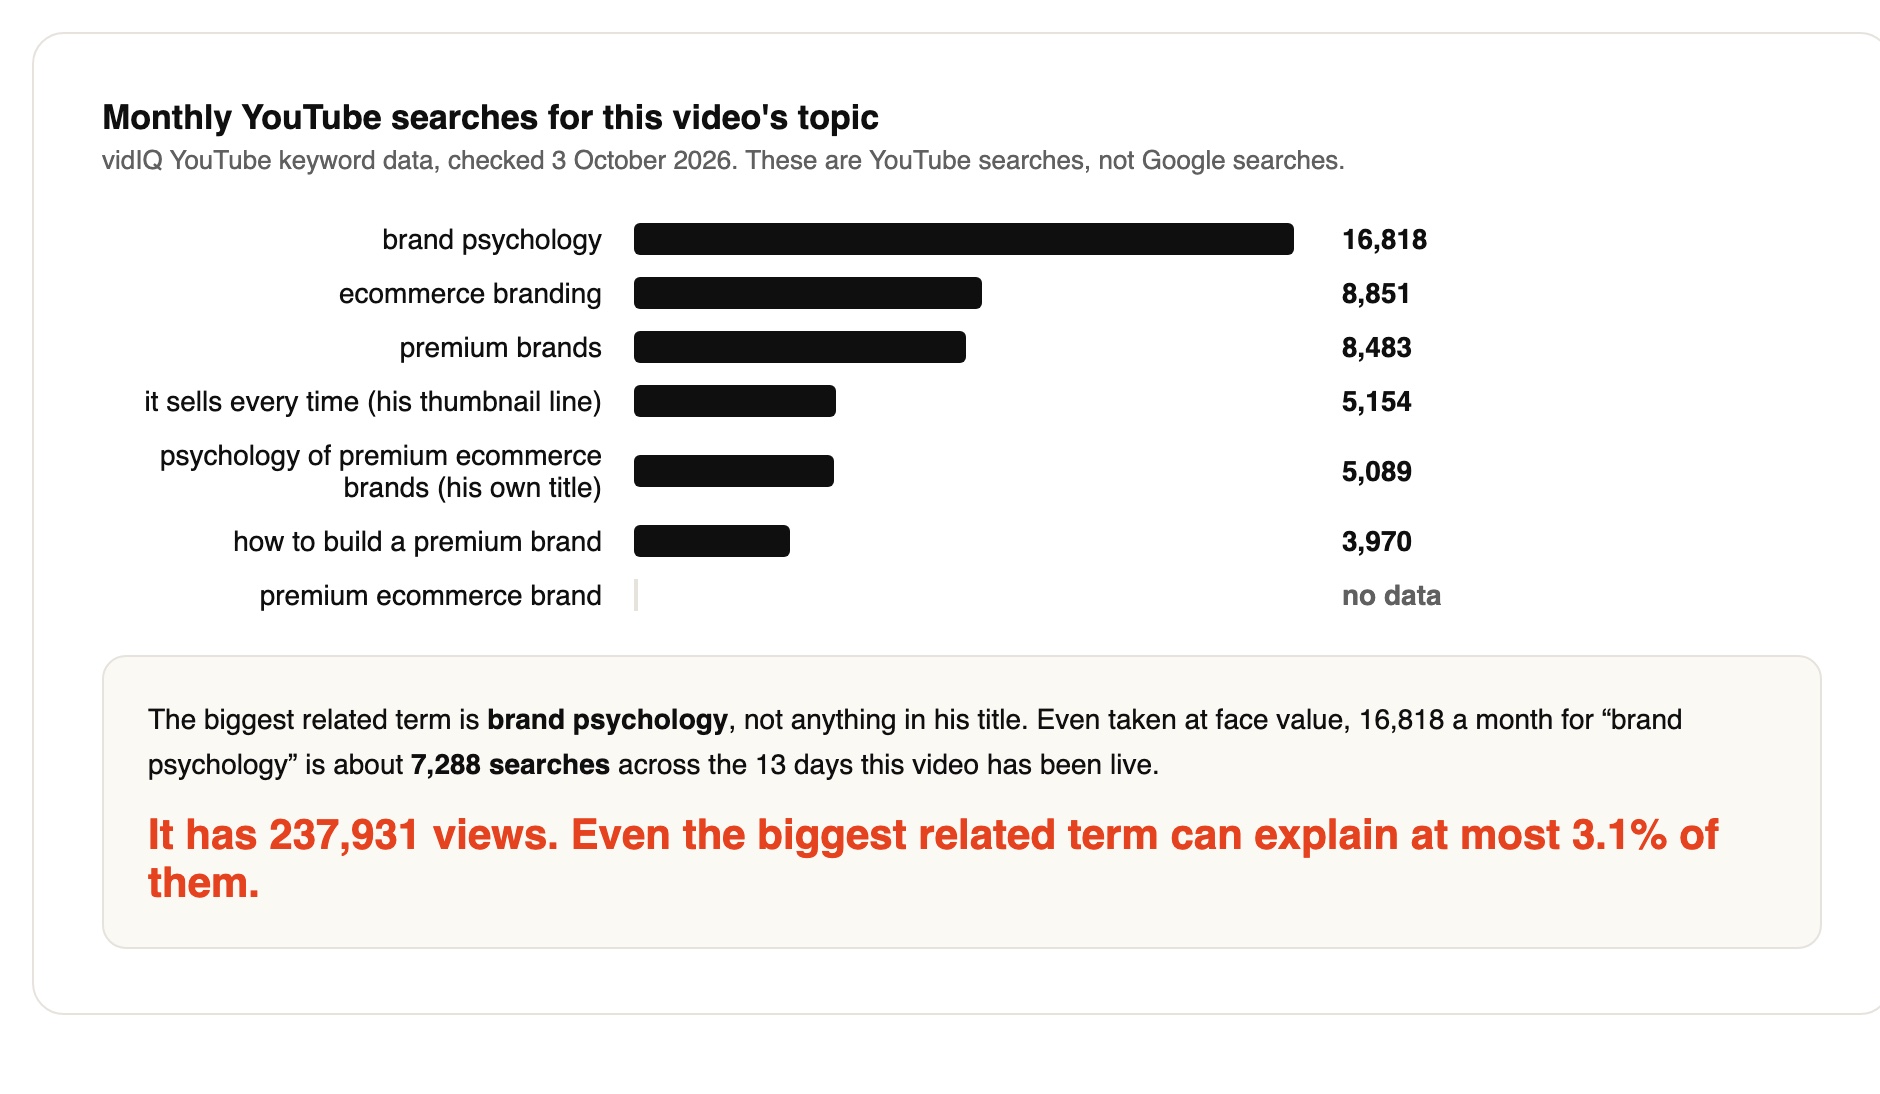
Not from search, news or his followers. Even the biggest related search term can explain at most 3.1% of the views, so I think browse and suggested did the work.
Browse and suggested means YouTube putting the video on someone’s home page or in the “up next” list, instead of the viewer typing a search.
I used vidIQ’s YouTube keyword data, which counts YouTube searches, not Google searches. The biggest related term is “brand psychology”, not anything in his title.
- “brand psychology”: 16,818 searches a month
- “ecommerce branding”: 8,851
- “premium brands”: 8,483
- “it sells every time”, his thumbnail line: 5,154
- “psychology of premium ecommerce brands”, his own title: 5,089
Here is the ceiling. 16,818 searches a month times 13 days live, divided by 30, is about 7,288 searches. If every one of them clicked this video, that is still 3.1% of 237,931 views.
The 5,089 searches for his own title have no baseline, so the video itself may be creating them.
On news, I found no wave on premium brand psychology. The only brand story was an Axios report on 22 September that Graza, one of the three products in his thumbnail, had hired Lazard to explore a sale.
That came two days after upload, so any lift from it is coincidence at most, and we cannot measure it.
On followers, he had only 1,660 subscribers on upload day, and the biggest social account is about 10K. Neither can make 237,931 views.
According to the comments, only 1 of 33 viewer comments hints at discovery, and it says nothing about how:
This is a really good video I’m glad I found you. Thank you…
We do not have his traffic sources, so I am inferring browse and suggested from the search ceiling and the shape of the curves.
My verdict is that browse and suggested carried this video, so the next sections compare what YouTube could see (the subject, the thumbnail, the opening) against the videos around it.
Is It the Subject? (Brand Studies Versus Ads and AI Tutorials)
I think the subject is the strongest pattern on the channel. Every upload that has passed 5,000 views is a study of named consumer brands.
Here are all five, with views on 3 October 2026:
- September 2024: a review of CBUM’s STNDRD fitness website, 9,354 views
- 31 July 2026: “The Secret Behind Weirdly Addictive Brands”, 26,770 views
- 12 August 2026: the Bloom, Poppi, Grüns and IM8 video, 24,543 views
- 20 September 2026: this video, 237,931 views
- 30 September 2026: the “1,000 Hours” remake, 9,499 views
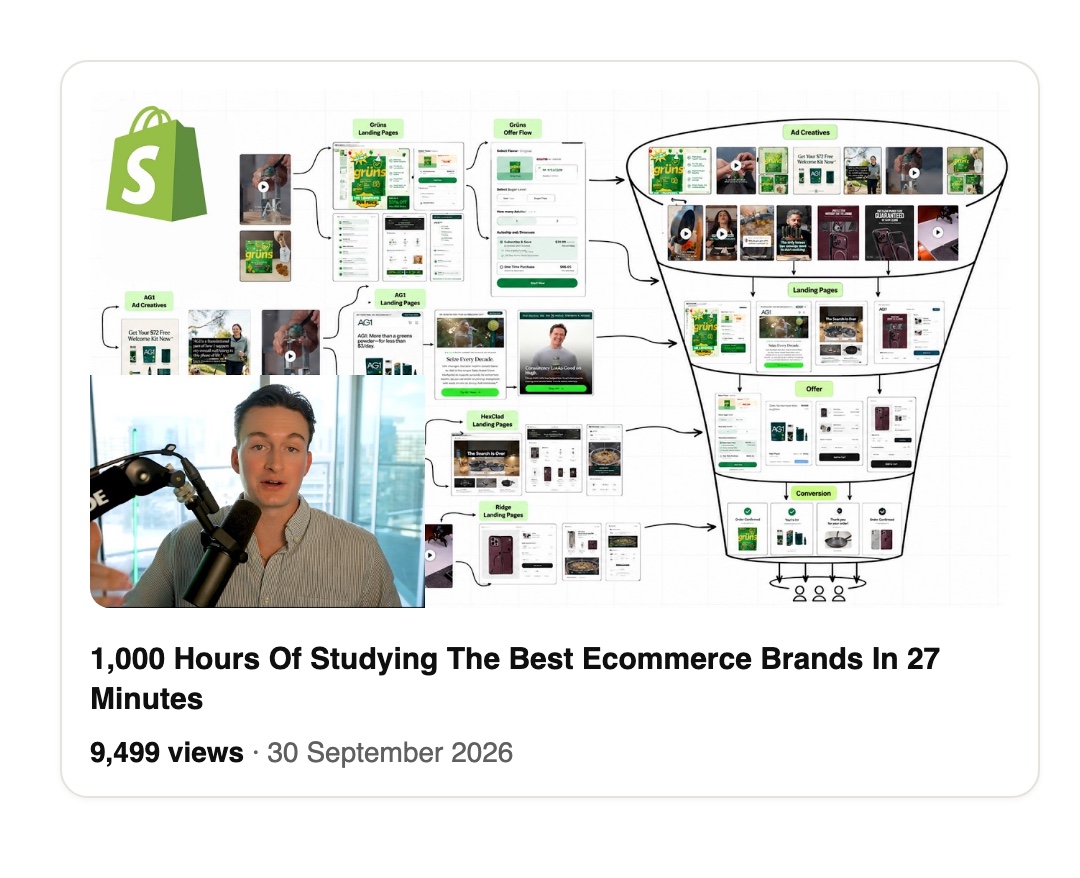
The best upload that is not a brand study got 3,275 views, a video on Alex Hormozi’s advice for ecommerce brands. The September tactic uploads sat at 467, 656 and 639.
The three big ones also share a shape. They are “why do these several brands win” studies, and all three woke up late.
“Waking up” means an old video suddenly gets recommended and starts adding views, long after upload.
- The 12 August video had 870 views after three weeks, then went from 870 to 8,613 in three days (4 to 7 September), with no thumbnail change recorded.
- The 31 July video stayed under 5,000 views for seven weeks, then added about 1,000 to 1,900 a day from 19 September.
That second date is one day before this video went up.
Now the evidence against. Between May and June he made single-brand funnel audits, which are walkthroughs of how one brand turns visitors into buyers. They named brands and stayed small:
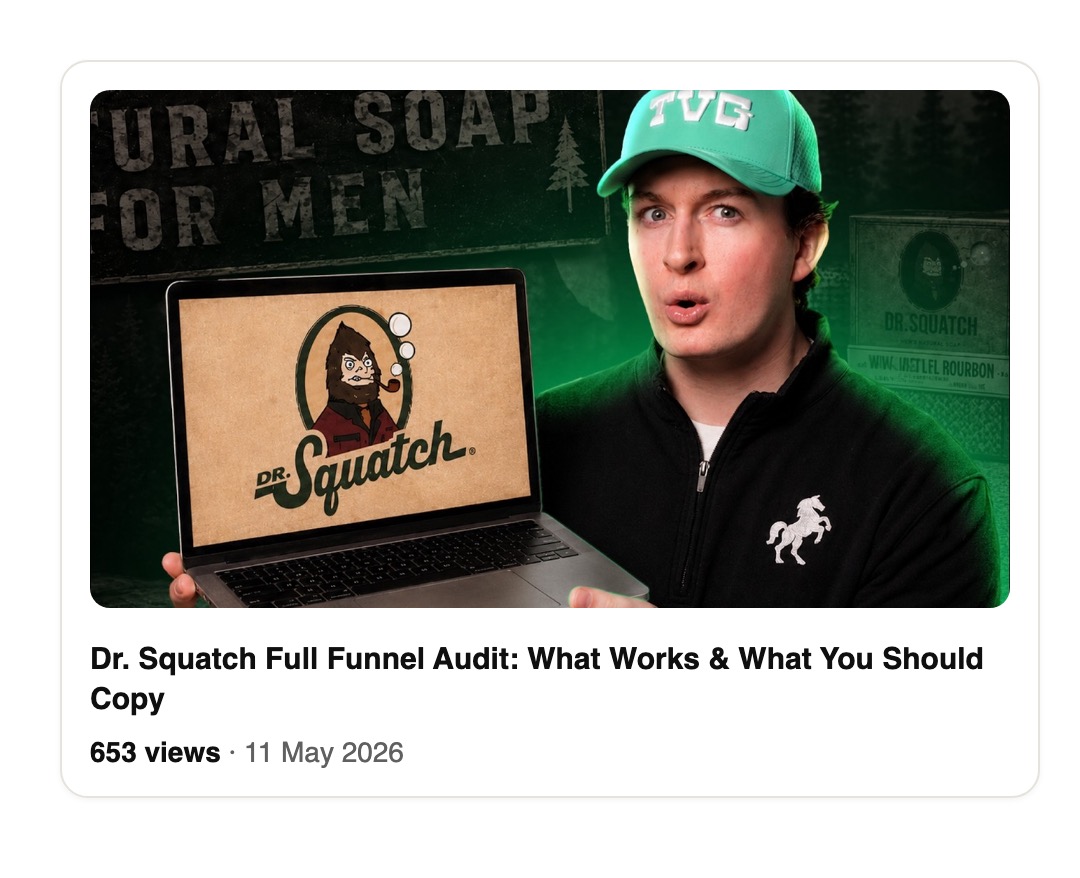
- Dr. Squatch 653, Ridge 158, IM8 639, Lola 997
- Manscaped 154, TRTL 102, Bala 133, Harry’s 112, Magic Spoon 1,840
Eight of the nine had his face on the thumbnail, next to one brand’s logo or product. The Harry’s one shows another man. So subject and face are harder to separate than they first look.
There is one more piece of evidence against me. On 1 July he posted a multi-brand study, “1000 Hours Studying the Best eCommerce Brands in 34 Minutes”.
It had a faceless thumbnail, a grid of brand logos, and it stayed at 1,600 views.

So neither the multi-brand subject nor a faceless multi-brand thumbnail is enough on its own. I think the “why do these brands win” angle matters, but three hits on one channel is a pattern, not a test.
Audience size may be part of the subject story. A brand-psychology video appeals to anyone who shops, while Facebook ad strategy mostly appeals to people who run ads.
The same creator, Sabri Suby (525,000 subscribers), has one of each:
- “How Luxury Brands Brainwash You to Buy”: 3,896,447 views
- His Meta ads video: 427,639 views
The luxury video is about 22 months older, so it has had far longer to collect views. Still, the top brand-psychology videos reach about 2.4 to 4.9 million views.
The top Facebook ad strategy videos top out around 430,000. I think that is a real gap in how many people could be interested.
The honest counterpoint is search. On YouTube search the ads side is bigger: “facebook ads” gets 620,326 searches a month, against 16,818 for “brand psychology”.
So I think this is a browse advantage, not a search one. It may also explain why the 15 September Facebook ad creative video did not take off even with the copied layout, because its possible audience is smaller.
The same point could explain why “The Psychology of Premium Ecommerce Brands” can reach more people than a “Facebook Ad Creative” title.
The audience may include shoppers and students, not only brand owners. According to the comments, the top comment (62 likes) is a reflection on his discount point:
Constant discounts really do train customers to wait for the next sale. I hadn’t thought about it that way.
One commenter says they have just started an MBA, and nobody says they own an ecommerce brand. That is only 33 viewer comments, so I would treat it as a hint.
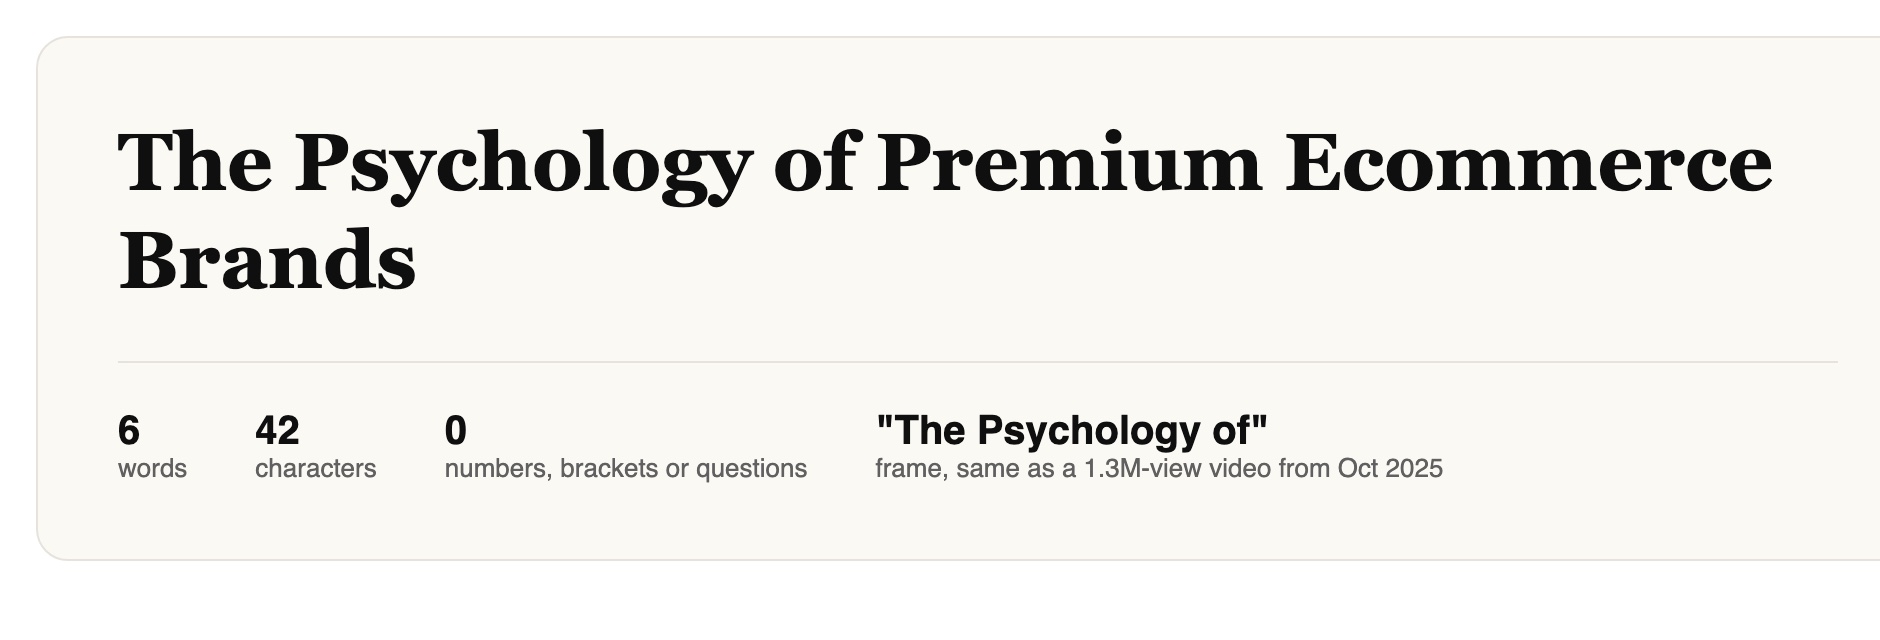
The title is a plain topic label, and the frame is borrowed too. Omar Eddaoudi’s video “The Psychology of Premium Branding” was posted in October 2025 and has 1,310,268 views on a channel with 32,800 subscribers.

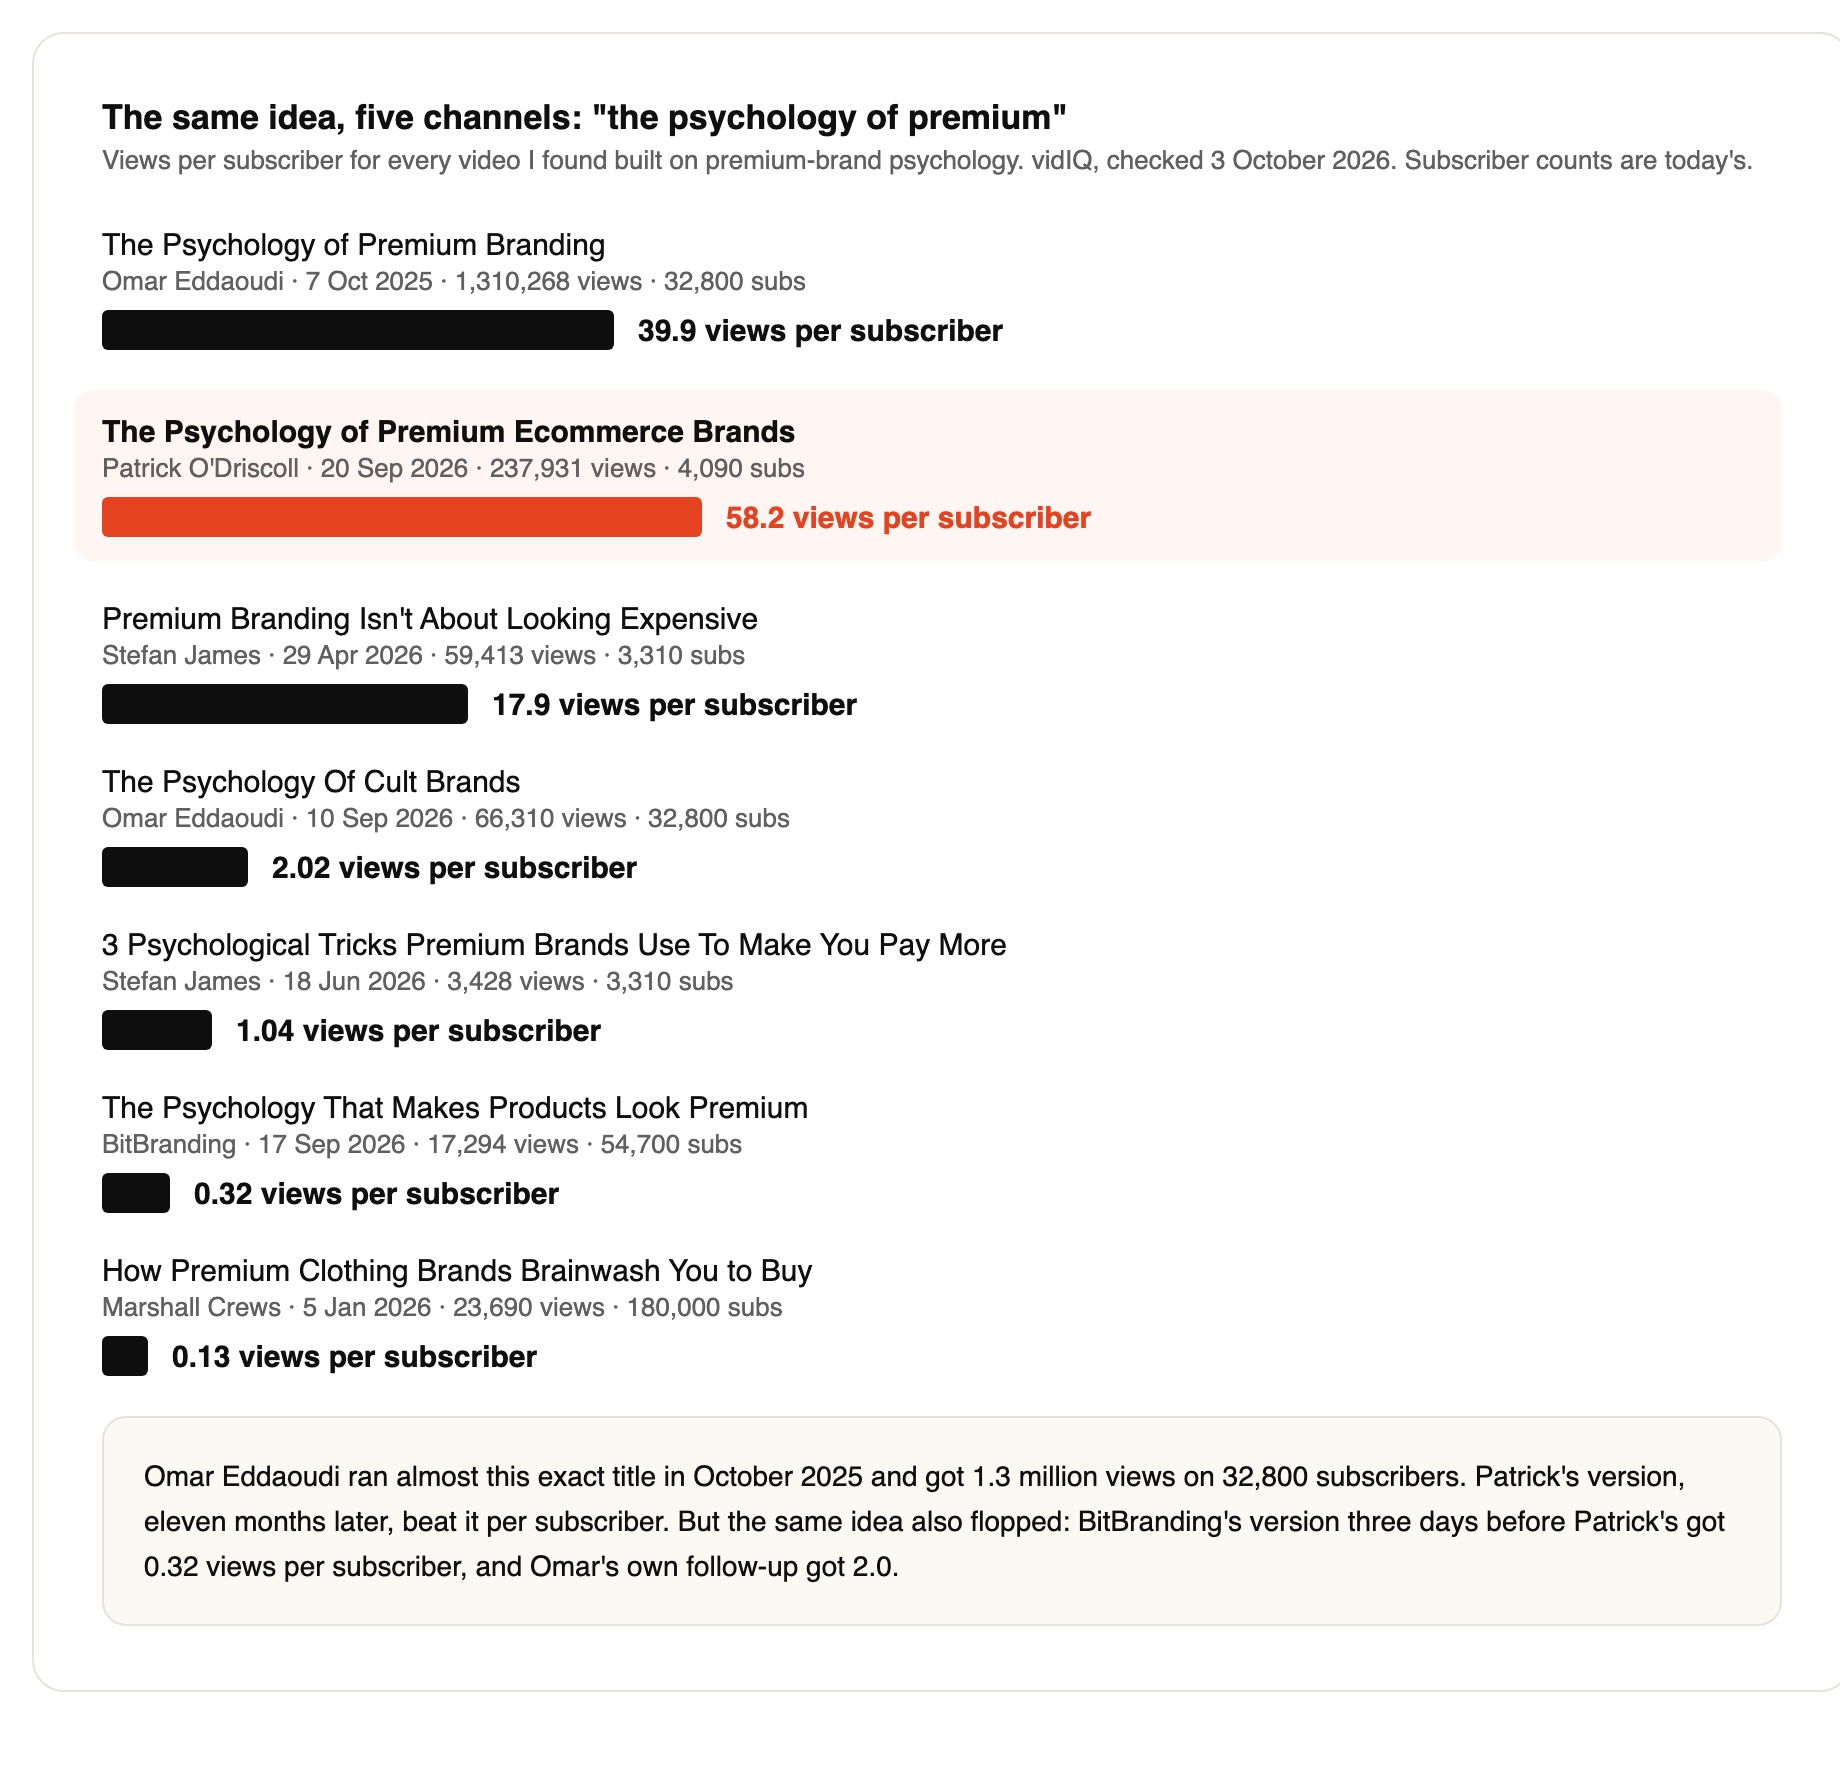
Views per subscriber is the views divided by the subscriber count, which lets a small channel be compared with a big one. Omar’s original is 39.9, and Patrick’s is 58.2.
But the same idea flopped elsewhere. BitBranding’s version, three days before Patrick’s, got 0.32 views per subscriber, and Omar’s own follow-up got 2.02.
So the title frame alone is not the reason. These numbers use today’s subscriber counts, so Patrick’s 58.2 is on 4,090, not the 1,660 he had on upload day.
My verdict is that the subject is the strongest difference, but it is a within-channel pattern, and it moves together with the thumbnail style and the timing.
Did the Thumbnail Swap Matter? (Famous Products, No Face)
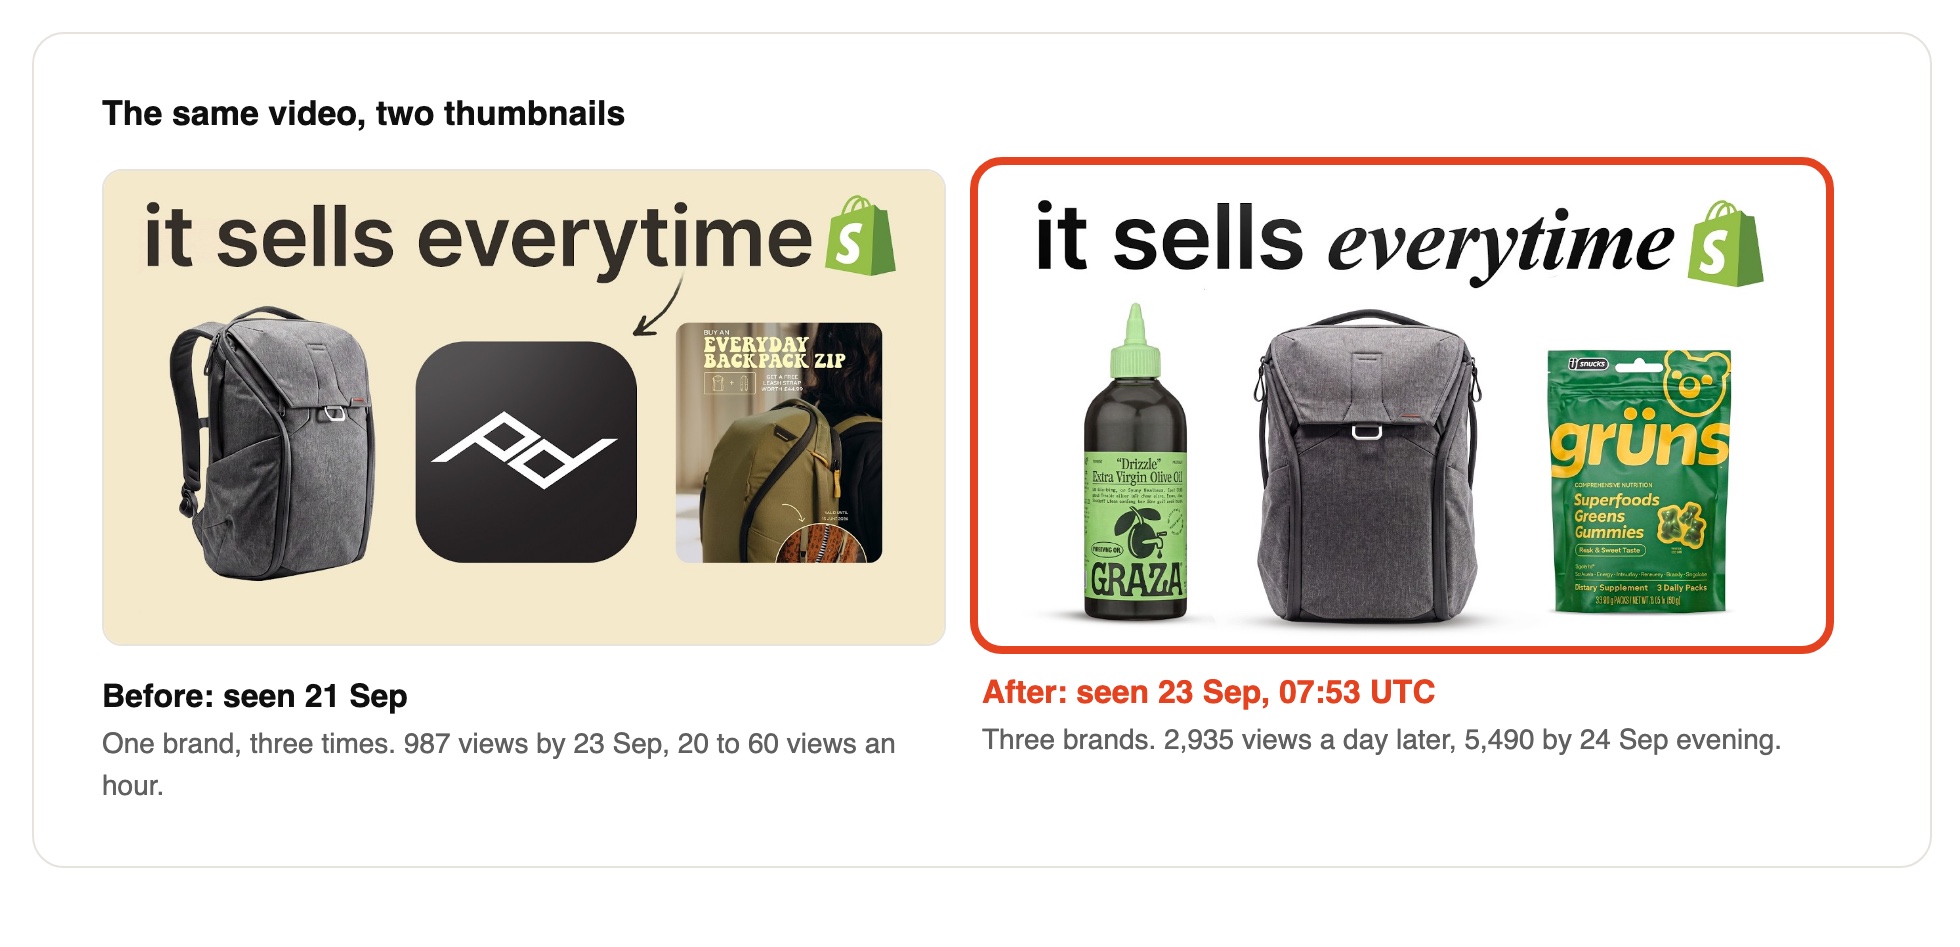
It lines up in time with the bend in the curve, but I do not think it proves anything on its own. I would call it a possible spark, not the cause.
The first thumbnail had a cream background and one dark font. It showed three Peak Design images: a backpack, the brand’s logo tile with an arrow, and an ad screenshot.
The second has a pure white background, “it sells” in bold sans-serif and “everytime” in italic serif. It shows three different brands as clean cut-outs: Graza olive oil, the Peak Design backpack and a Grüns pouch.
I think the new one looks very premium and minimal: clean white, three real products, and an italic serif for “everytime”.
The old one did not look premium to me. It had a cream background, a logo tile, and an ad screenshot with small text.
So I think the swap added real value. I can only show that it lines up in time with the climb, not that it caused it.
vidIQ saw the first thumbnail on 21 September at 09:47 UTC and the second on 23 September at 07:53 UTC. It logs when it saw a change, so the swap happened somewhere between those two times.
Views per hour moved like this:
- Before: 0 to 74 on every hourly reading, mostly 20 to 60
- Evening of 23 September: 62 to 107
- Afternoon of 24 September: 209 to 222, with a spike of 687 at 18:19 UTC
- Total views: 987 at midnight on 23 September, then 8,868 by the morning of 25 September
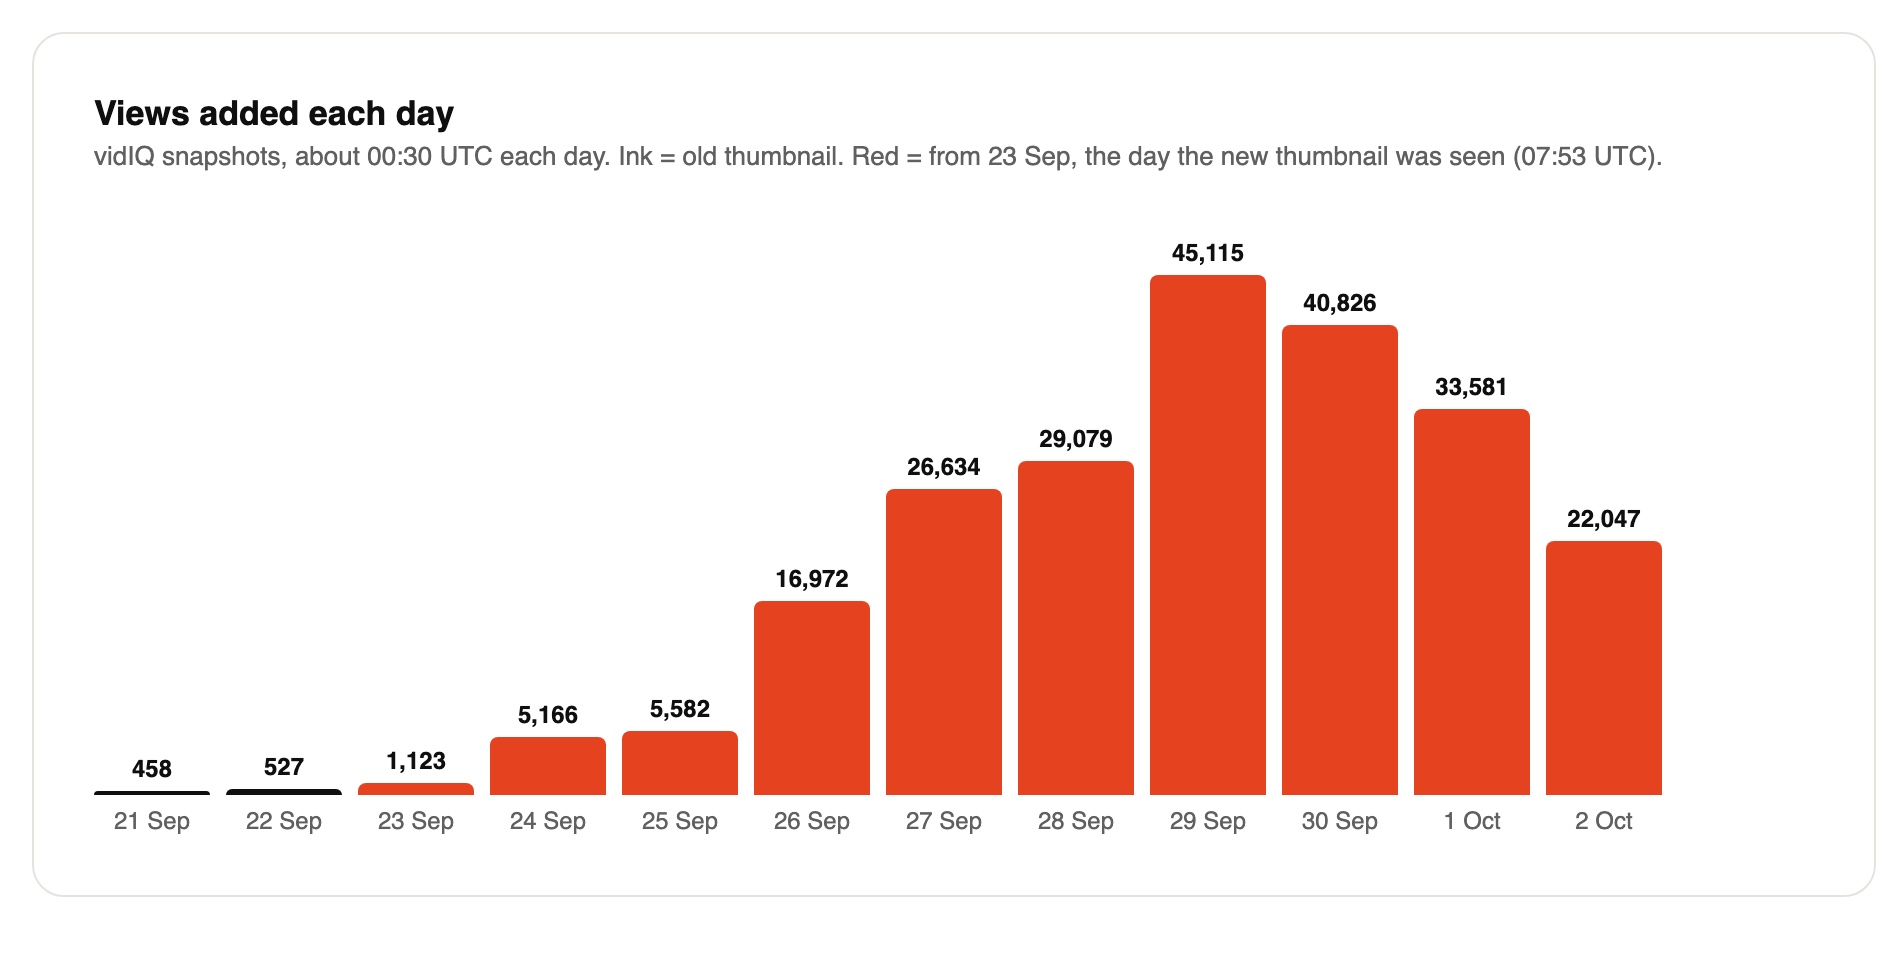
That looks neat. But there are four reasons it is not the whole story:
- YouTube tests a new video on wider audiences in its first days anyway, so some of the bend may have happened regardless.
- The 31 July video had its thumbnail swapped on day one and still slept for seven weeks.
- The 12 August video woke up with no swap recorded.
- The 31 July video woke on 19 September, before this one even existed.
There is also a direct test. By 29 September he had put this layout on the 15 September ads video: one black lowercase line, a platform logo, three items on light grey.

It stayed at about 30 to 60 views a day, from 434 on 29 September to 627 on 3 October. So the layout alone started no breakout.
It is not a clean test, though. The copy used ad screenshots, not famous products, and the topic was ads.

None of the three hits shows his face, and each is built from several known brands. The September flops used his face, the 15 September one until he swapped it, which vidIQ saw on 29 September:
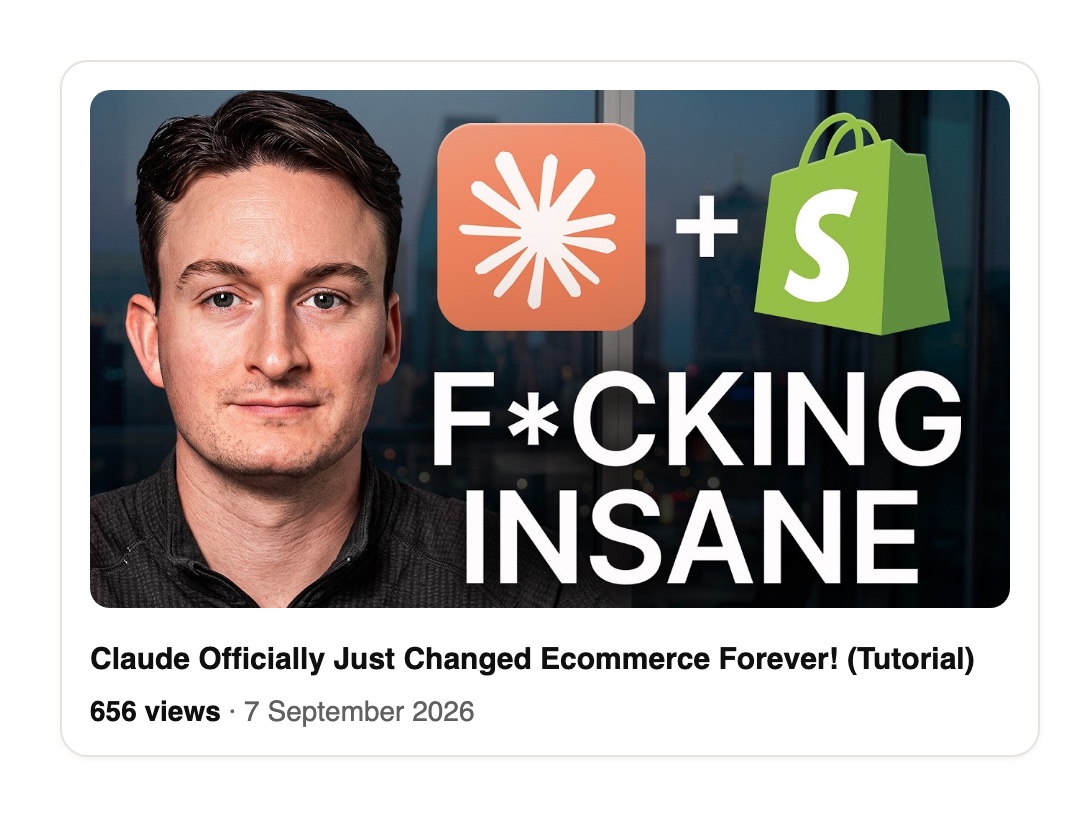

But the topic changed at the same time, so face against no face is not isolated.
The face is a muddier clue than it looks. His face is on eight of the nine May and June single-brand audits, and none of the nine passed 1,840 views.
But his face is also on the 2024 STNDRD review (9,354 views) and the 30 September remake (9,499 views on 3 October 2026). So a face thumbnail can still pass 5,000 on a brand study.
Swapping is also routine for him: the 30 September remake had its thumbnail swapped within three days.
Paddy Galloway says, “What is actually being shown in the thumbnail is so much more important than the design,” in his Creator Science interview. Three famous products do show something concrete, which fits.
My verdict is that the swap is a plausible spark for this one video, but the other two hits and the copied layout stop me calling it the reason.
Did the Opening Do the Work? (Prices on Screen, No Name)
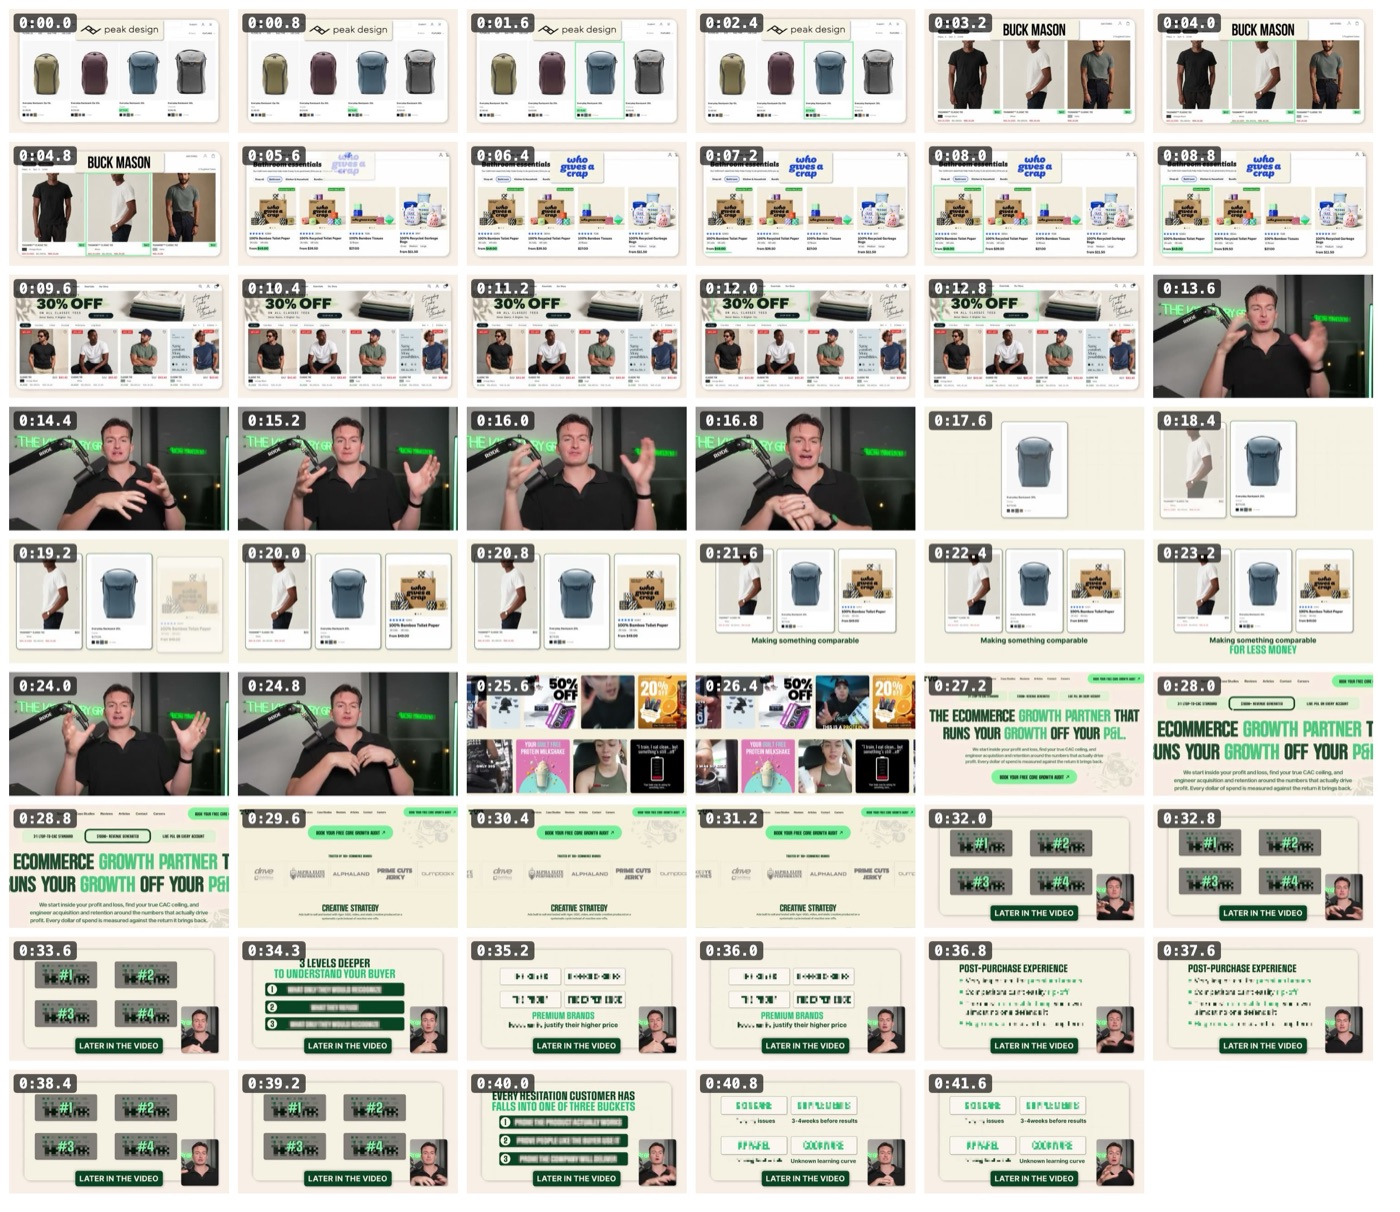
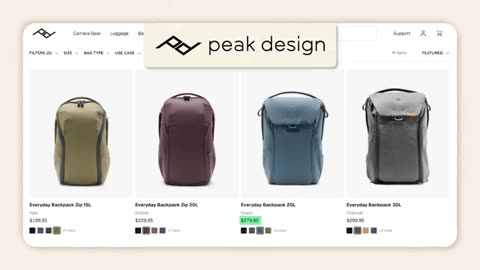
The first frame at 0:00 is Peak Design’s store page, with the same grey backpack that sits in the thumbnail. The original thumbnail was all Peak Design too, so at upload the opening matched it almost exactly.
Graza and Grüns, the other two products on the current thumbnail, show up later in the video, Graza at 3:05 and Grüns at 14:51.
Colin and Samir call the first beat “confirm the click”: the viewer must know straight away that this is the video they meant to click on.
On The Futur page they say the opening “must deliver on the promise of the thumbnail”.
Their “confirm the click” label and its 0 to 7 second timing come from a thread reader page, not a raw copy of their thread, so I would treat them as approximate.
I think this intro is really good, and this is why. It puts the thumbnail’s backpack in the very first frame, with real store pages as proof.
The opening is unusual and I like it, but I do not think it started the breakout.
It runs 43 seconds with 17 shots, and the first 9 seconds name three brands with exact prices, each proved on its own store page:
- 0:00 to 0:09: a Peak Design backpack at $280, a Buck Mason white tee at $62, and Who Gives a Crap toilet paper at $49, each price outlined in green
- 0:10: a rival’s “30% OFF” banner, logo blurred, as a foil
- 0:23: a credential by results, “$100 million plus in combined sales”, with no name
- 0:32 to 0:42: pixelated tiles tagged “LATER IN THE VIDEO”
There is no “my name is” anywhere. The 7 September and 15 September videos both have a “My name is Patrick” block, at 0:27 and 0:17.
At 0:37 he promises that by the end you will know which of the four areas is costing you margin.
George Blackman says to be super specific in a hook, and exact prices shown on screen do that. I think it is the strongest part.
It also breaks a rule. Colin and Samir say a new question should land by about 30 seconds in their thread, and this one lands at 0:37.
The limits are clear. The opening was identical in the slow first days, when the video added only 458 and 527 views a day.
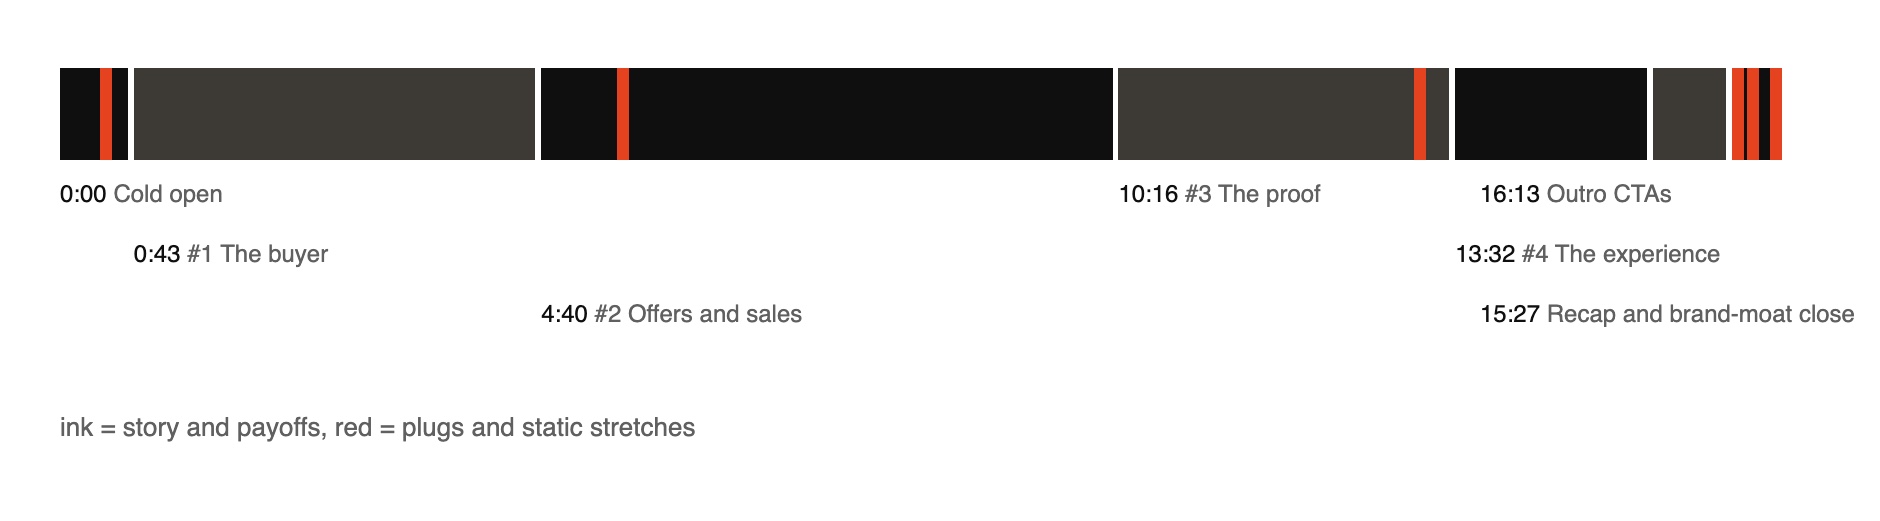
The rest of the edit is busy. It has 290 cuts, about 17 a minute, and the longest stretch without a cut is 23.6 seconds. I cannot say whether that differs from his flops.
Also, the 0:37 margin promise is never paid off. Nine loops open and eight close. At 15:54 he only says to evaluate your brand.
He also plugs hard: a 23-second ad for the free audit at 13:08 and three end calls to action. It still took off, so the plugs did not stop it.
My verdict is that the opening is a good, specific one and may have helped viewers stay, though I cannot check that without his Studio retention, and it cannot be the spark, because it was there for the slow days too.
Which Difference Do the Numbers Point To?
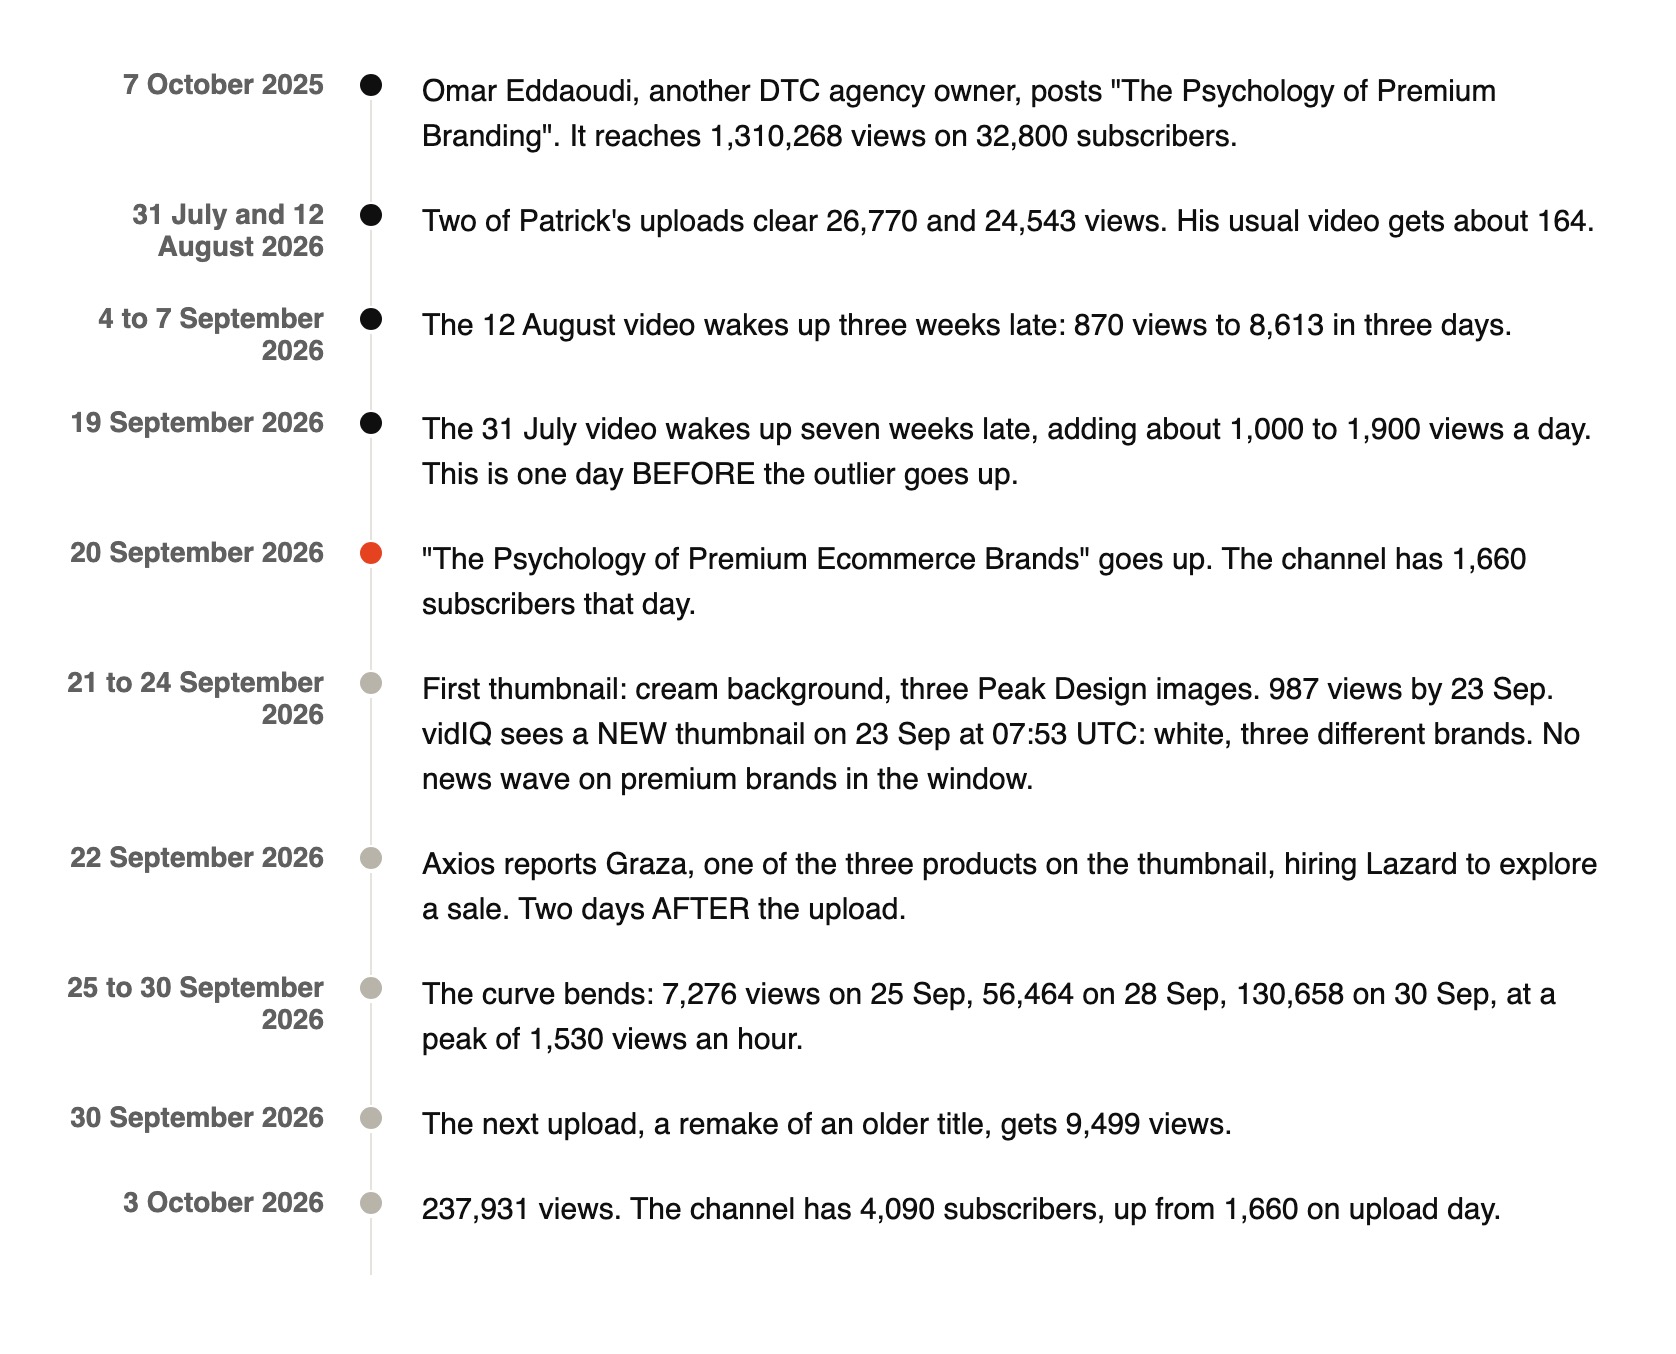
I think the subject is the one the numbers point to most. The swap is a possible spark, and the opening is a supporting part.
Here is how each difference holds up:
- Subject: present in all three big videos and absent from every September flop. But the 1 July multi-brand study stayed at 1,600, and the copied layout alone did nothing.
- Swap: lines up with this video’s bend, but not with the other two hits.
- Audience: brand psychology reaches anyone who shops, which may be why the ads video stayed small, though ads win on search.
- Opening: the same through the slow days, so it did not start anything on its own.
I need to name the confounds plainly. Subject, faceless thumbnails and the timing mostly moved together, so I cannot separate them.
The faceless 1 July study that stayed at 1,600 shows the subject plus a faceless thumbnail was not enough on its own.
Also, the 31 July video waking up on 19 September suggests a wider push on the channel may already have started before upload. The outlier’s description links to that video as “the free training”.
It may have fed this video, or this video may have fed it. We cannot see shared traffic.
After the spike, he remade an old title, which had 9,499 views on 3 October 2026, about 59 times his old median of 160.
That is suggestive, but it is one upload, and it also had a thumbnail swap, which vidIQ saw on 3 October.
I would not call it a new baseline yet.
Here is a prediction I can be scored on. Take every long upload from 4 October to 15 November 2026, and read its views at 14 and 30 days.
- Every brand study should clear 5,000 views at 14 days, and at least one should pass 20,000 within 30 days.
- Every ads, tools or tactics upload should stay under 3,000 views at 14 days.
I will score it on 15 December 2026. If a tactics video beats a brand study, or no brand study goes up, I am wrong. If the split holds but a number is missed, I was half right.
My verdict is that this leans mostly towards strategy. The subject, the swap and the matching opening were his choices, and what looks like a channel-wide push is the smaller luck part.
I think this was mostly strategy. He picked the subject that had already worked twice on his channel, swapped to a thumbnail I think looks far more premium, and opened on the same Peak Design backpack page his first thumbnail showed. His next upload, the 30 September remake, also did well, with 9,499 views on 3 October 2026, about 59 times his old median of 160. The small luck part is what looks like a channel-wide push from 19 September, when his older 31 July video woke up a day before this one went up.
I would sort my catalogue by topic, find the one that blooms late, and make the next video on it within days, with a thumbnail swap ready if views are flat.
How Would You Run This Test on Your Own Channel?

You can run a small version of this on your own catalogue in an afternoon. Treat each step as a test, not a rule.
- Sort your uploads by topic and look for the topic whose videos bloom late.
- When an old video on that topic wakes up, publish the next one within days and link both ways.
- If your video explains why a brand costs more, put well-known products on the thumbnail instead of your face. His hits did this, but the topic changed too, so treat it as a test.
- Check views per hour 36 to 48 hours after upload, and swap to a clearly different thumbnail if it is flat.
- Open on named examples with exact numbers shown on screen as you say them.
- Remake an old title of yours that already beat your median.
YouTube’s own help page warns that testing thumbnails that are too similar makes tests run longer. So a swap should look clearly different, as this one did.
Also, a swap on its own did not save his 15 September video, so do not expect the thumbnail to fix a topic that has not worked.
If I were you, I would start with step one this week. List your ten best videos, tag each by topic, and see which topic has the late wake-ups.
What We Cannot See Without His Studio Data
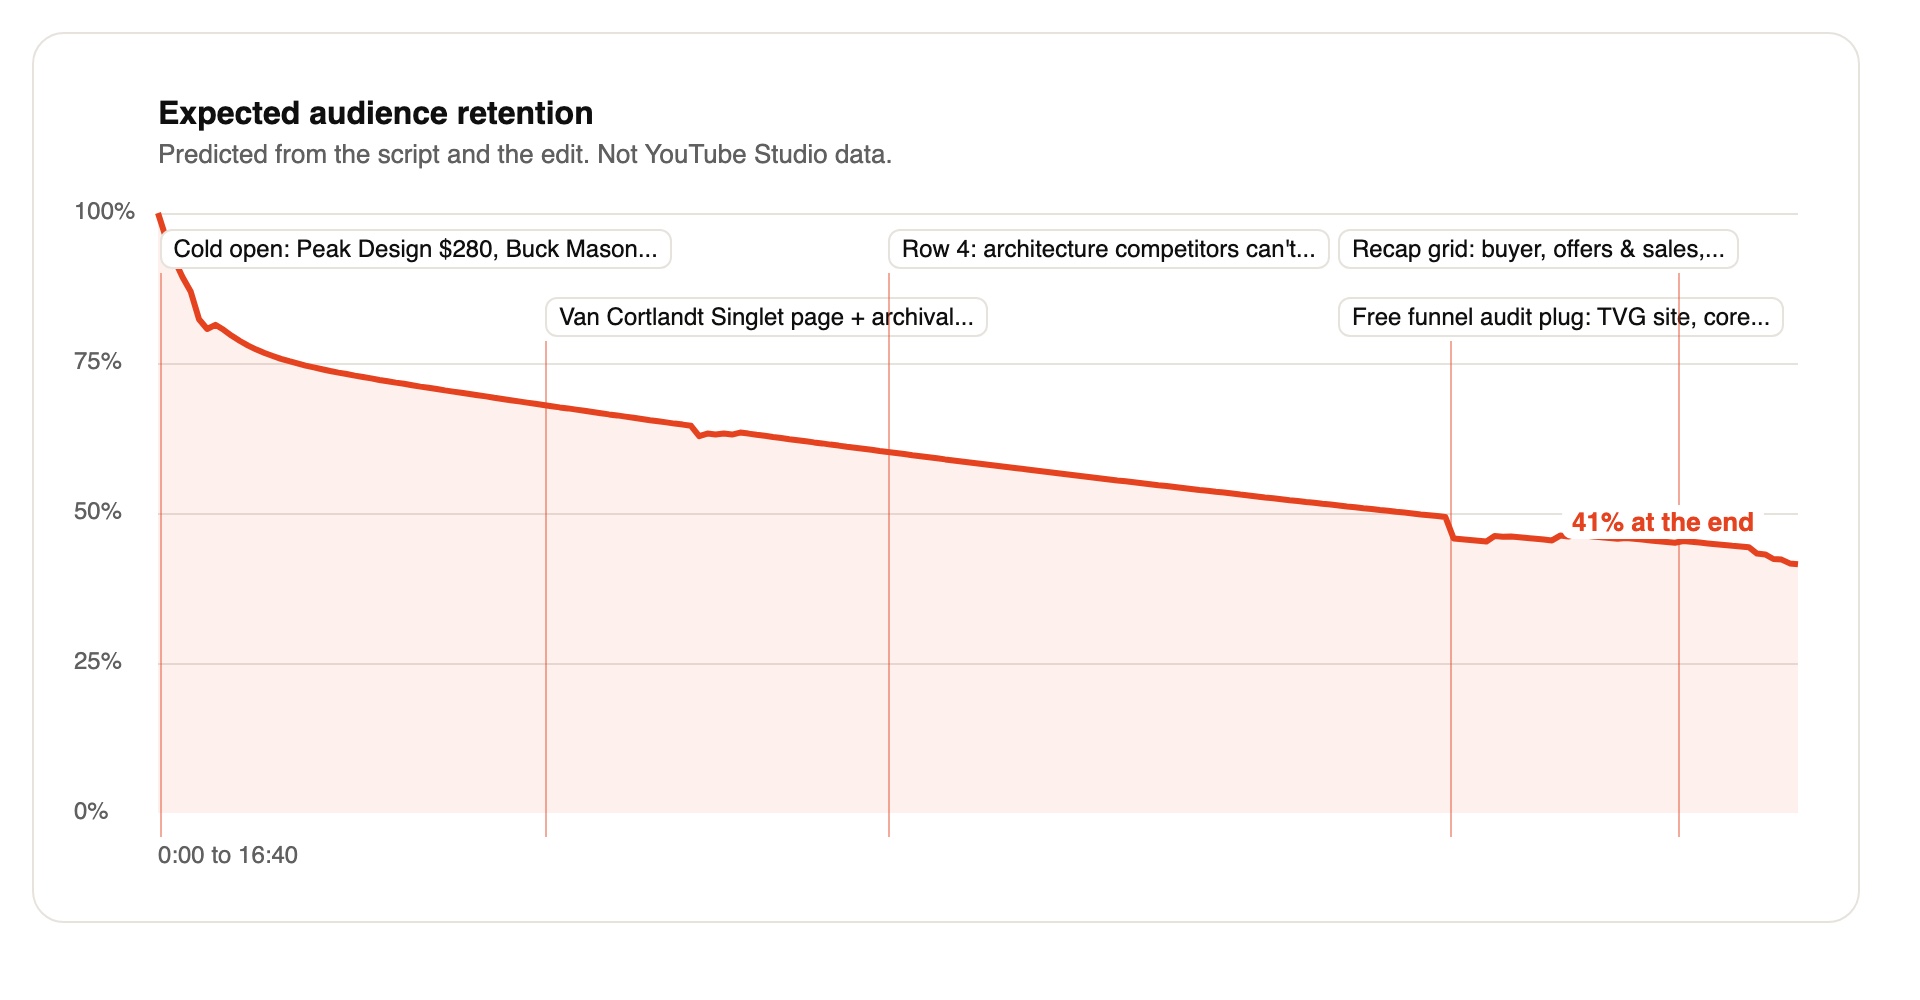
We do not have Patrick’s YouTube Studio. That means no impressions, no click-through rate, no traffic-source split and no real retention graph.
Impressions is how often YouTube showed the thumbnail. Click-through rate, or CTR, is the share of those people who clicked.
The retention card above is a model, built from 54 events in the script and the edit. It ends at 41%, but that is a guess, not his data.
Here is what else we cannot see:
- vidIQ logs when it saw a thumbnail change, not the minute it happened.
- Views per subscriber use today’s subscriber counts, not the counts at upload.
- Whether YouTube showed the outlier to viewers of the 31 July video.
- Who the audience really is, since we only have 33 viewer comments.
These open questions would settle most of this:
- Studio CTR and impressions for 21 to 25 September, split by thumbnail, would show if the swap mattered.
- More multi-brand studies with and without a face, or an ads video with a famous-products thumbnail, would separate topic from thumbnail.
- Studio traffic sources would show whether the 31 July video fed this one.
- His next three uploads at 14 days would show whether 9,499 is a lifted floor.
My verdict is that this is a good pattern to test, not a proven recipe. I would revisit it after the 15 December check.
If you want the next breakdown when it goes up, the Breakdown Theory newsletter is where I send it.